As Disney reports its latest earnings, Parrot Analytics has found the company stood at or near the top of the industry in many key demand data metrics for the full year 2021:
- In the United States, The Walt Disney Company was by far number one in corporate demand share (20.1%), well ahead of second place ViacomCBS (13.4%).
- Globally, Disney+ was the fastest growing streaming service in digital original demand share, driven largely by its slate of live action Marvel series.
- Hulu was the number one service for total on-platform demand share (library + original content) in the United States in Q4 2021, just beating out Netflix.
- Disney+ had four of the top five global TV series premieres of 2021, and five of the top ten.
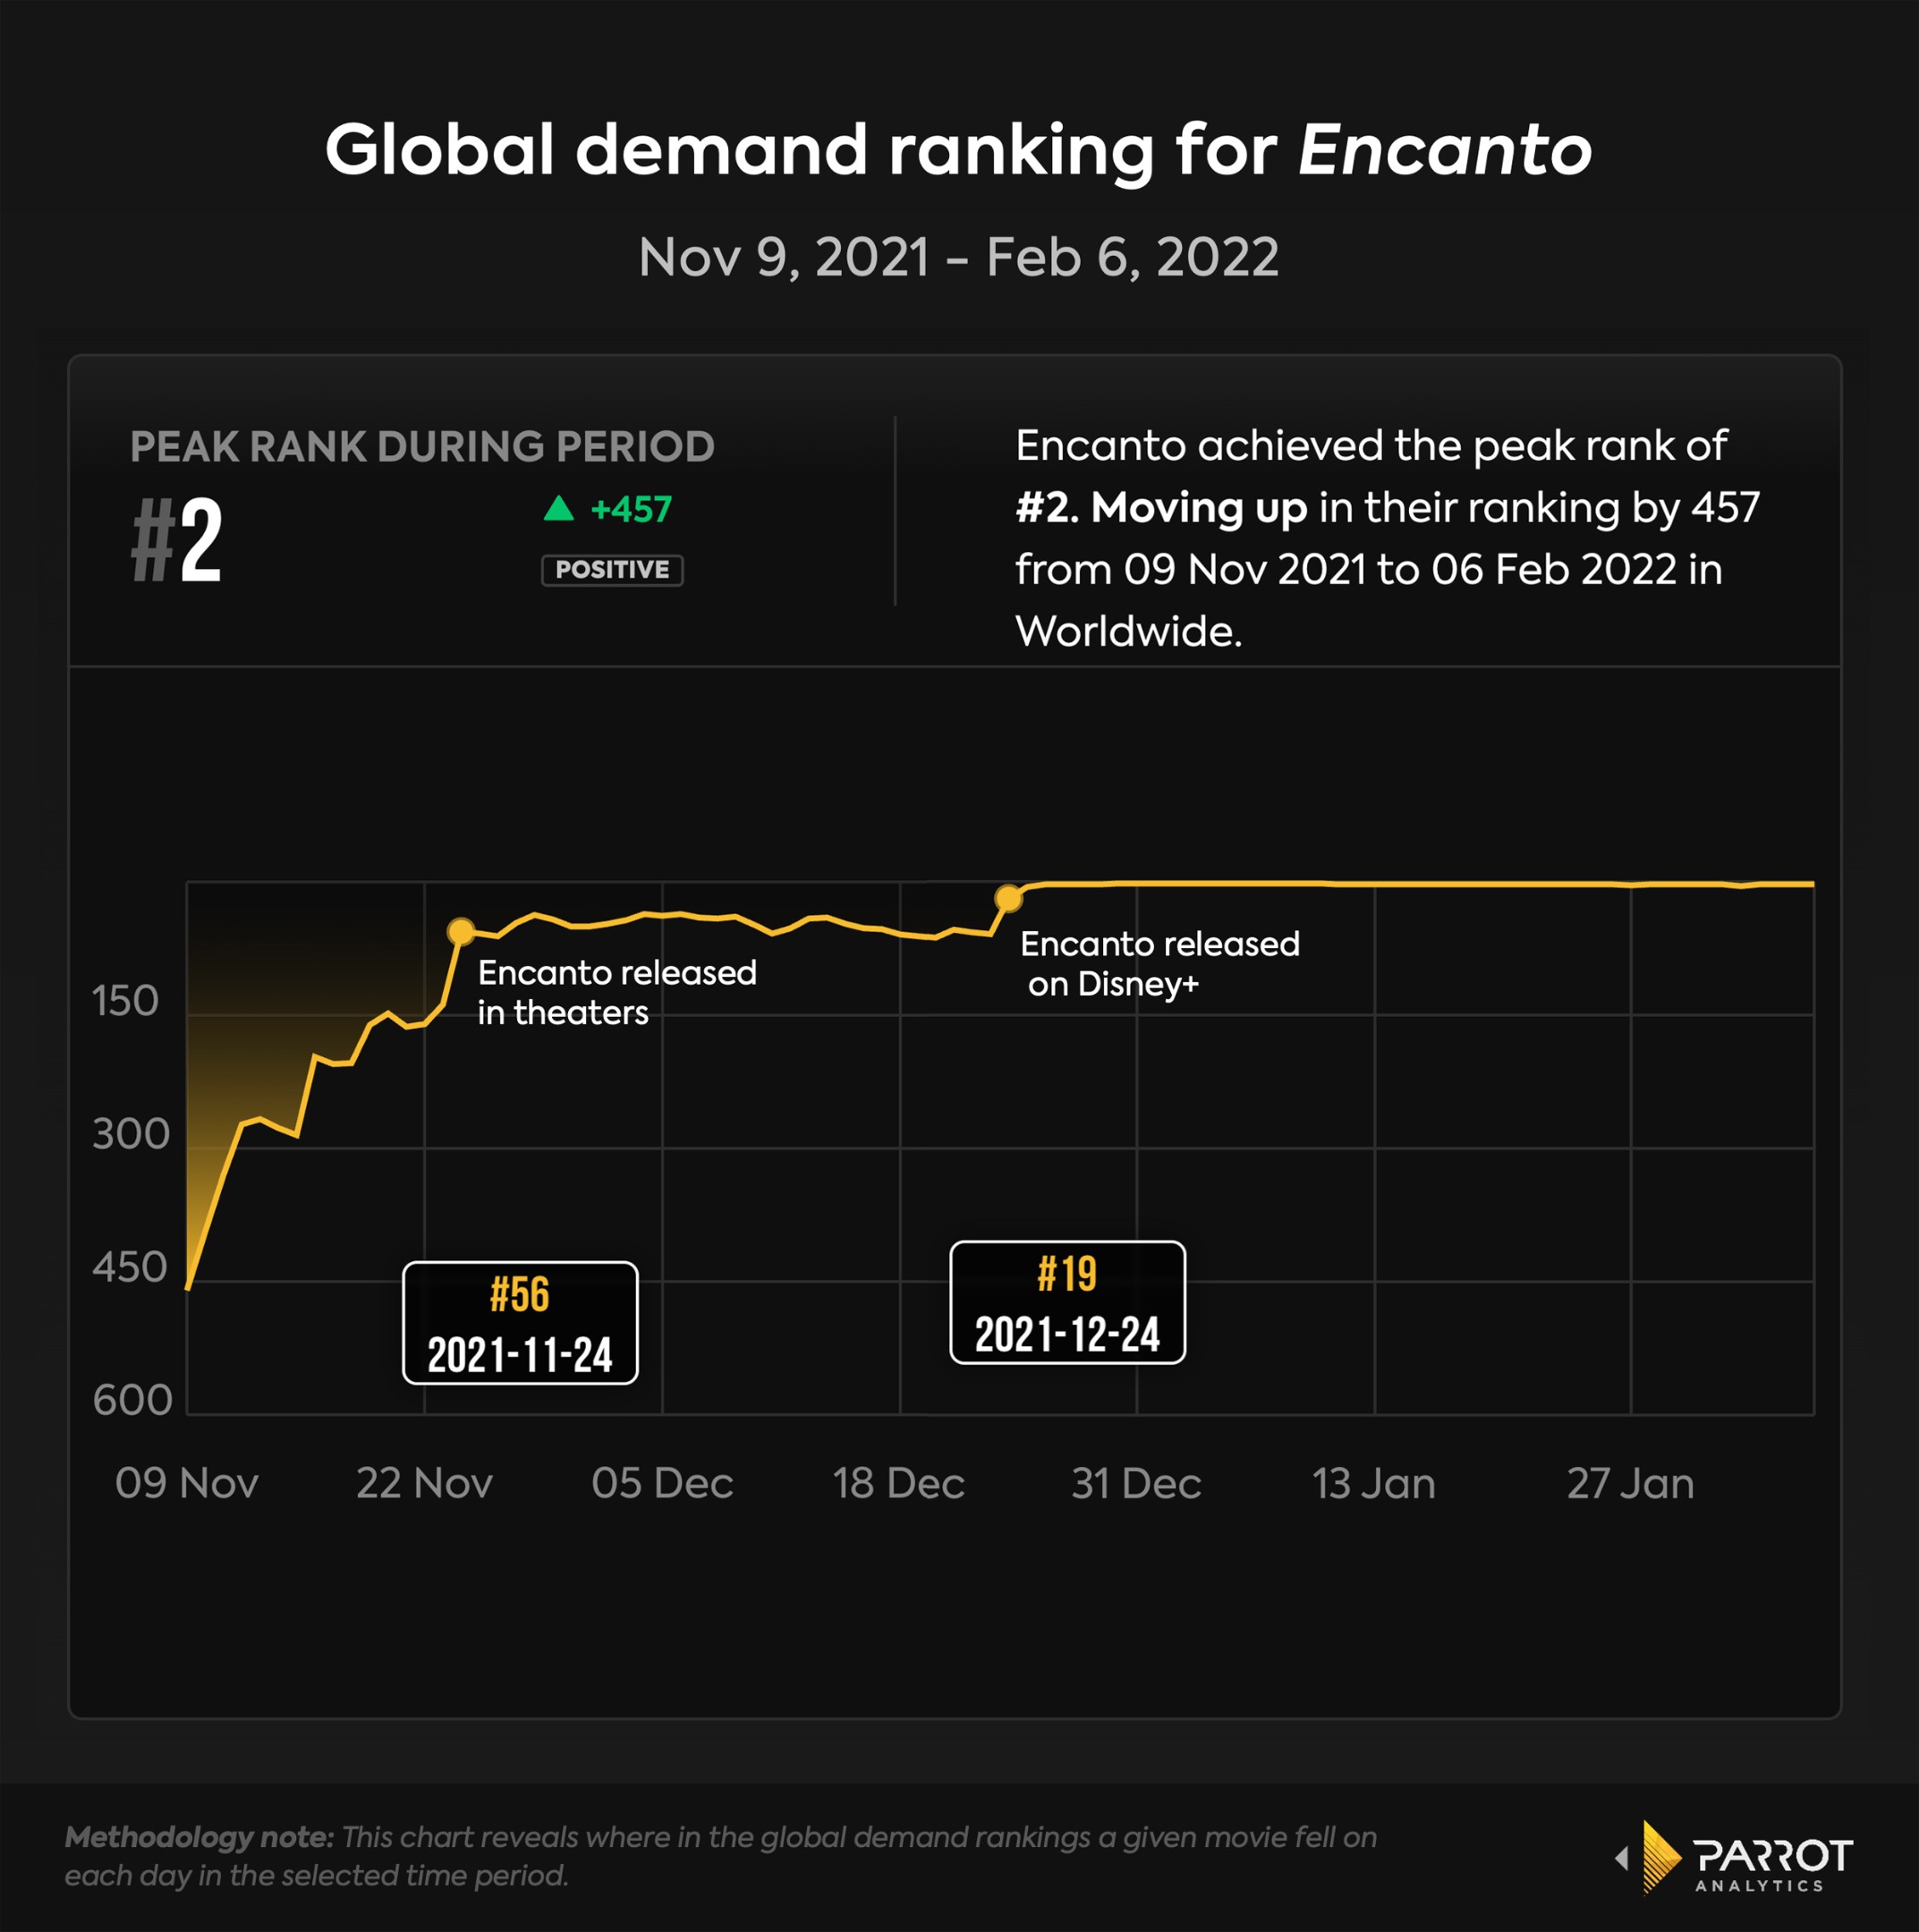
- Globally, Encanto quickly became the second most in-demand movie across all platforms following its release on Disney+. It peaked at only #36 during its 30-day theatrical run, showing the power of the Disney+ platform in driving up demand for its original content and validating Disney’s short theatrical window and hybrid release strategy.
We Don’t Talk About Theaters
- One of the biggest successes of Disney+’s latest quarter was the now Oscar-nominated animated movie Encanto.
- During Encanto’s exclusive theatrical window (Nov 24-Dec 23, 2021), it was 23.6x more in-demand than the average movie worldwide, with a peak demand of 25.9x and a peak rank of 36th most in-demand movie worldwide during that time period. \
- Since Dec 24 - when it became available worldwide on Disney+, Encanto has been 66.5x more in-demand than the average movie worldwide, and peaked as high as 76.6x. The movie rocketed up to become the #2 movie worldwide across all platforms within a week of the Disney+ launch, and it has stayed in the top five worldwide as of Feb 6, 2022.
- This demand data validates Disney's hybrid release strategy as studios struggle to figure out what works best in today's complicated environment, and provides an answer to what Disney+’s growth strategy is beyond a non-stop slate of Marvel and Star Wars series.
Corporate Demand Share - United States, Full Year 2021
(Click here for more details on how we calculate Corporate Demand Share)
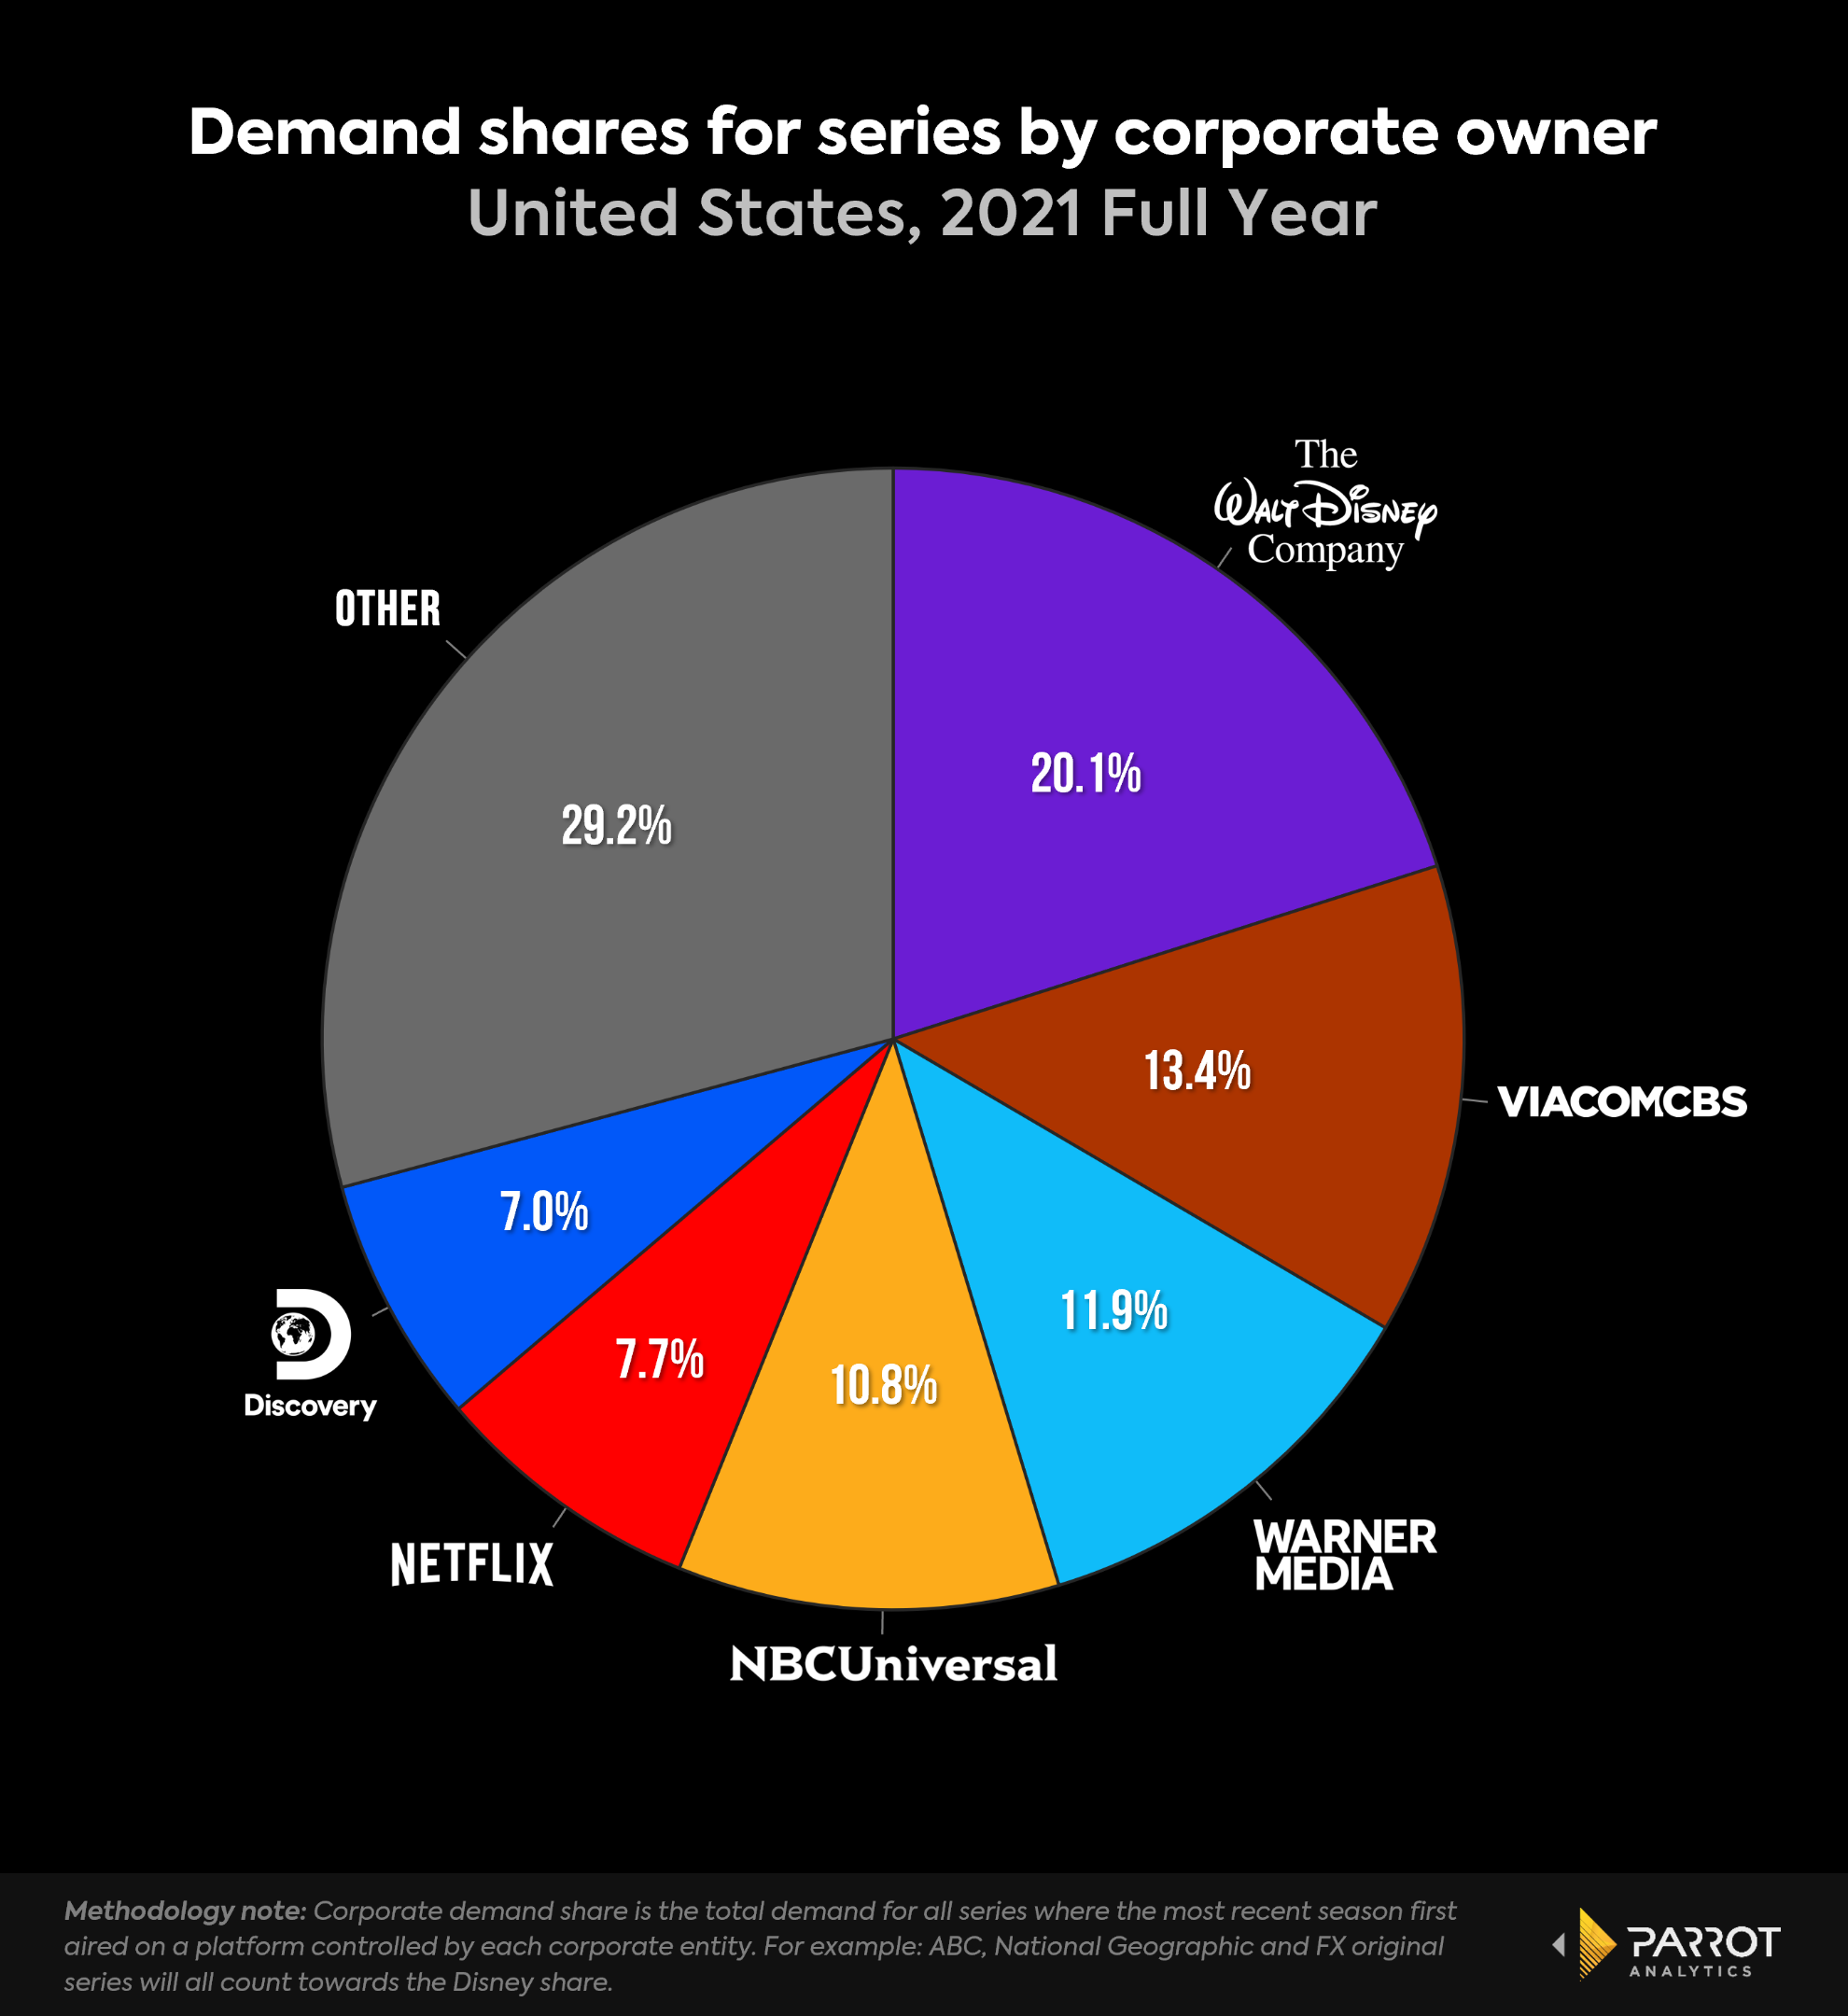
- Disney remains far and away the top media conglomerate in the United States when it comes to corporate demand share - a consolidation of original demand where platforms are combined based on their corporate parent to show where audience attention is ultimately going.
- Disney’s 20.1% share for the year was well ahead of second place ViacomCBS (13.4%). This was a slight decline from 2020, when Disney had 20.6% of US corporate demand share.
- Disney’s share is larger than the combined share of WarnerMedia and Discovery (11.9% + 7.0% = 18.9%), whose merger may close as early as May 2022, meaning it is poised to remain the number one media corporation with US audiences even after the combination of Discovery and WarnerMedia’s considerable assets.
- That said, the gap between Disney and the combined WarnerMedia-Discovery assets was smaller in 2021 (1.2%) than it was in 2020 (2.0%), suggesting the new Warner Bros Discovery could have momentum on its side.
- Collectively, the 6 largest media corporations control almost three quarters of US demand for TV series. 29.2% of audience attention goes to originals from platforms controlled by other corporate owners.
Digital Original Demand Share - Global, Full Year 2021
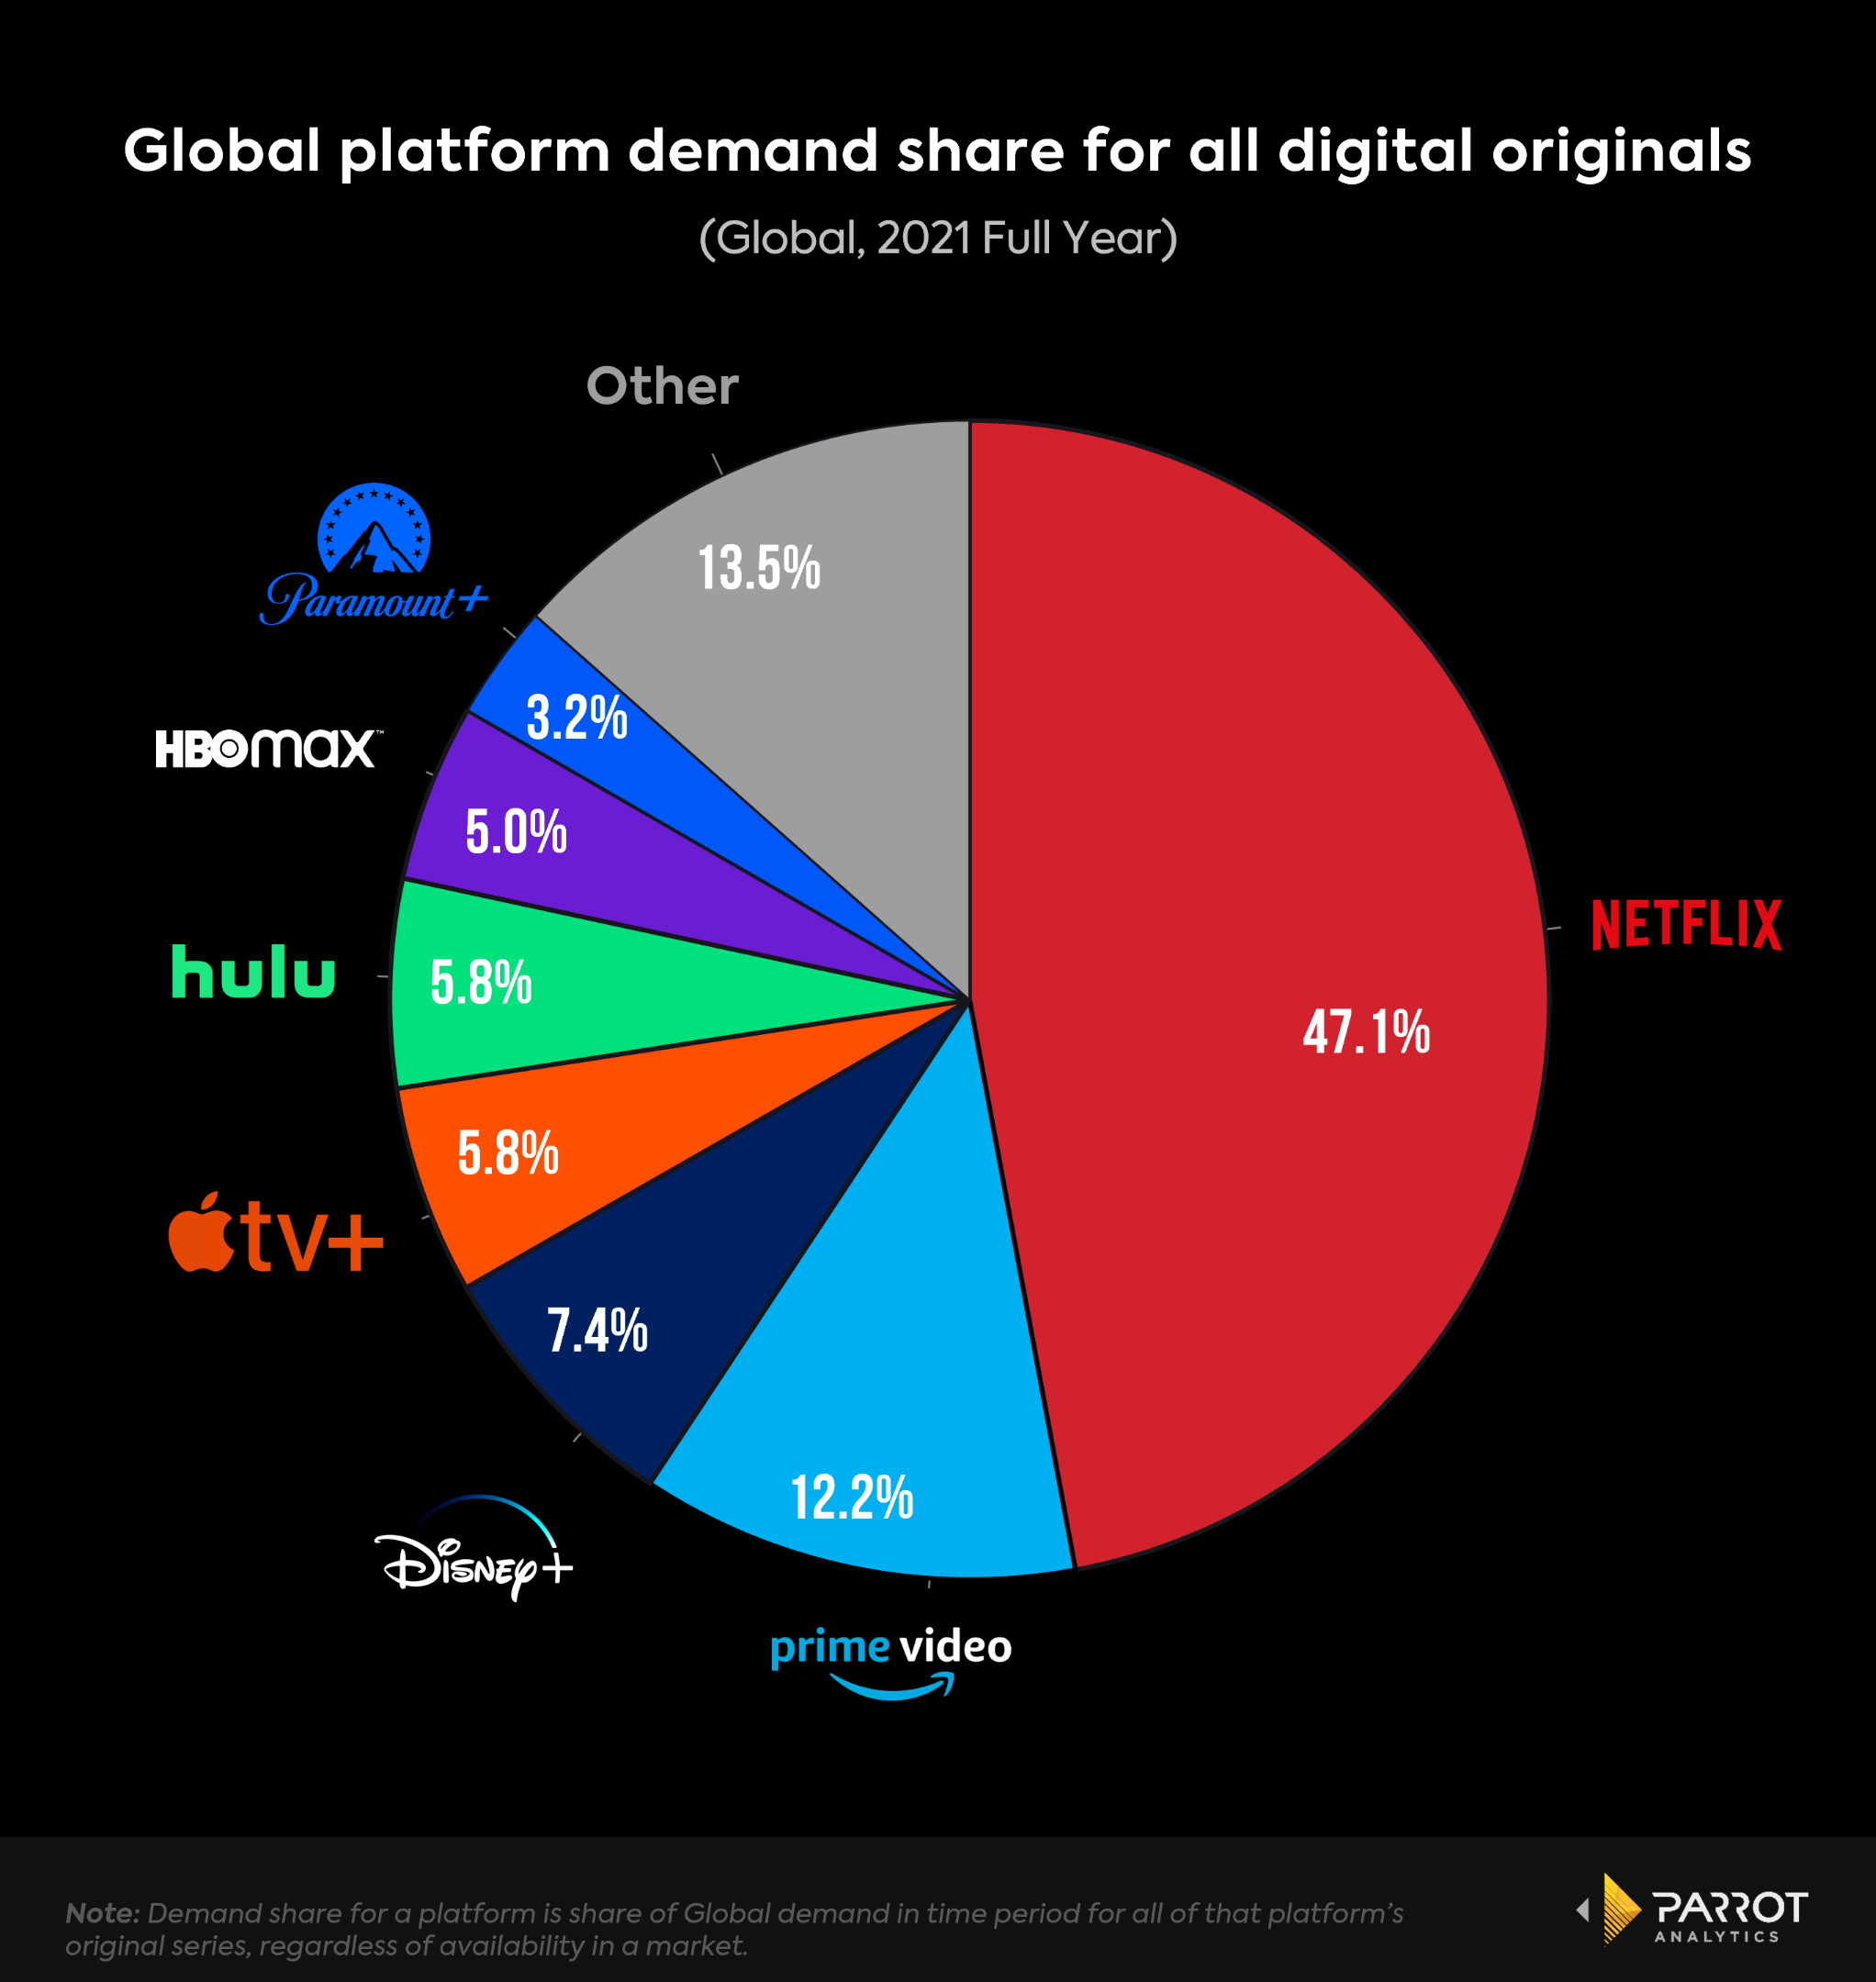
- Disney+ was a solid third place for global demand share for digital originals for the full year 2021, as Netflix slid to a new annual low in the face of steep competition from Disney+, Apple TV+, and HBO Max.
- Disney+, Apple TV+ and HBO Max were the biggest year-on-year winners. Disney+’s global demand share more than doubled - up 107% vs 2020 (3.6% to 7.4%). Apple TV+’s share grew 49.3% (3.9% to 5.8%), and HBO Max’s share grew 37.7% (3.6% to 5.0%).
- A theoretical combination of Hulu and Disney+ (5.8% + 7.4% = 13.2%) would vault ahead of Amazon Prime Video (12.2%) for second place in global digital original demand share.
On-Platform Demand Share - United States, Q4 2021
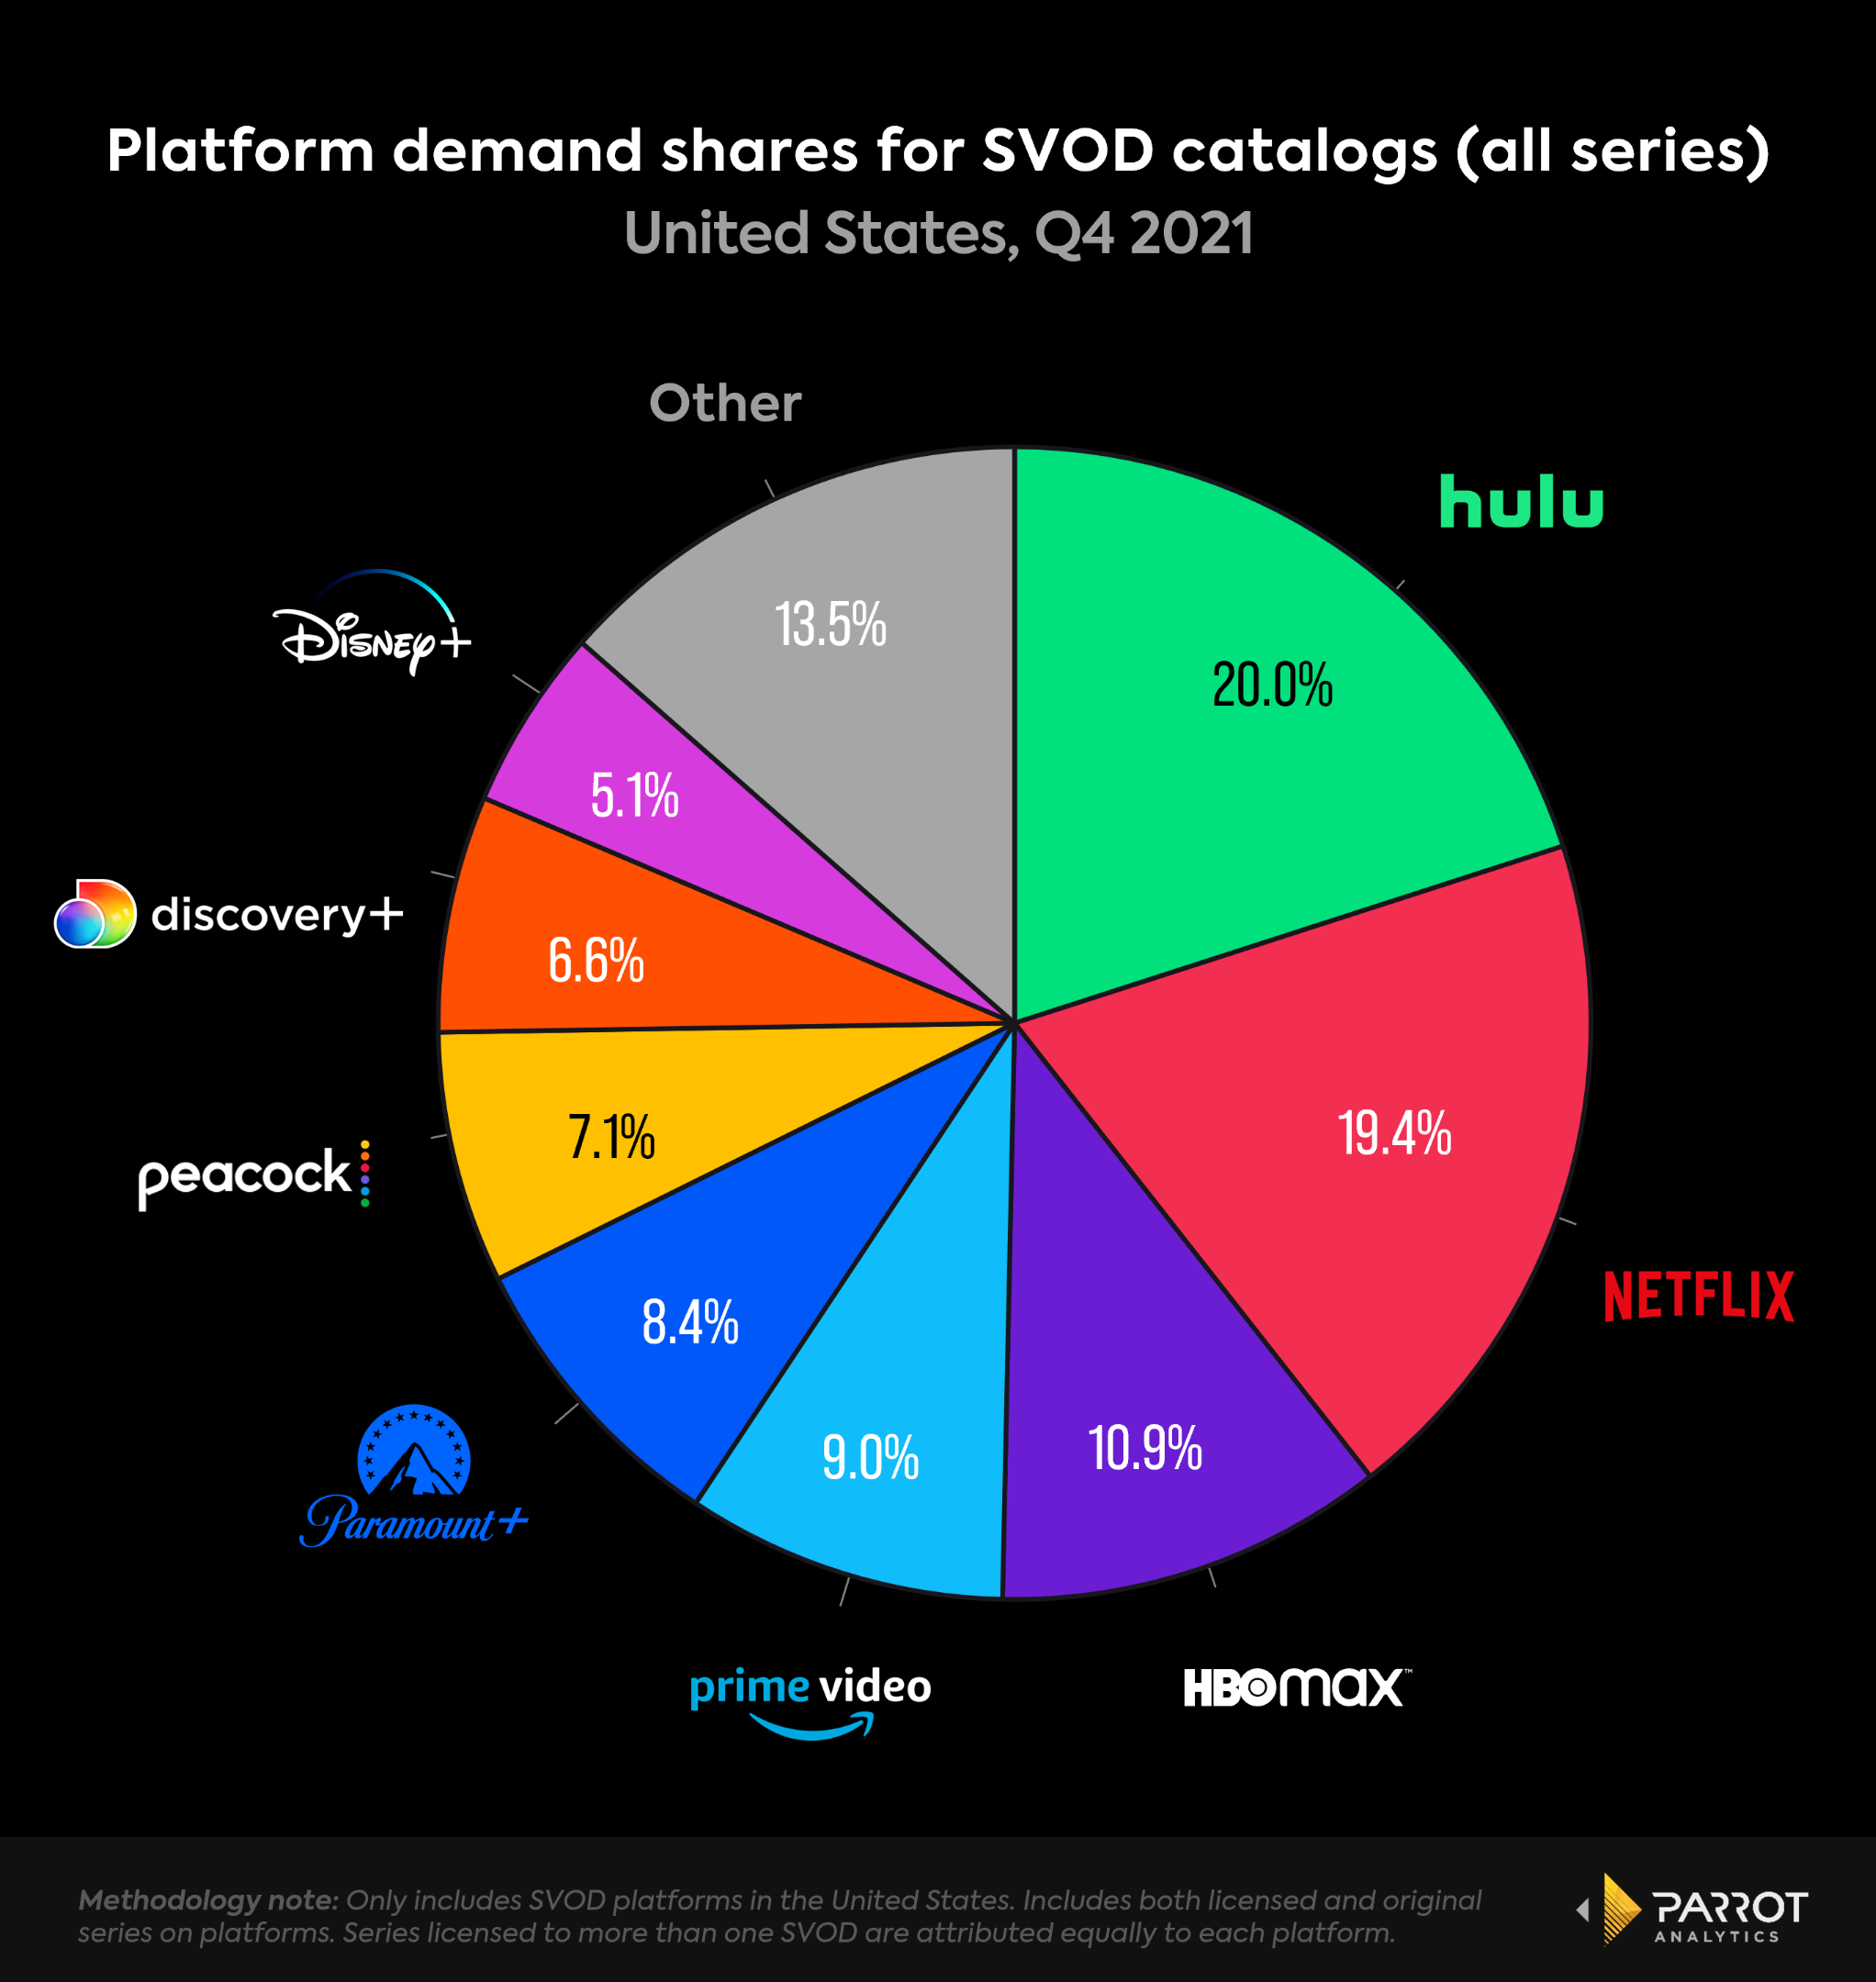
- Hulu (20%) just beat out Netflix (19.4%) in the race for on-platform demand share in the US in Q4 2021.
- This chart reveals the value and long term viability of the Disney bundle:
- Disney+’s 5.1% share is impressive given than most of that demand is coming from just a handful of massive digital originals. Demand for originals is key for subscriber growth and getting new customers on the platform.
- Meanwhile, Hulu’s massive library - and handful of hit adult-oriented series such as Only Murders in the Building, Dopesick, and Reservation Dogs, among others - makes it the most in-demand platform for overall content.
- Demand for library content is key to subscriber retention, so it’s easy to see how the Hulu and Disney+ combine to help keep Disney as one of the primary players in the streaming industry.
Most In-Demand Premieres - Global, Full Year 2021
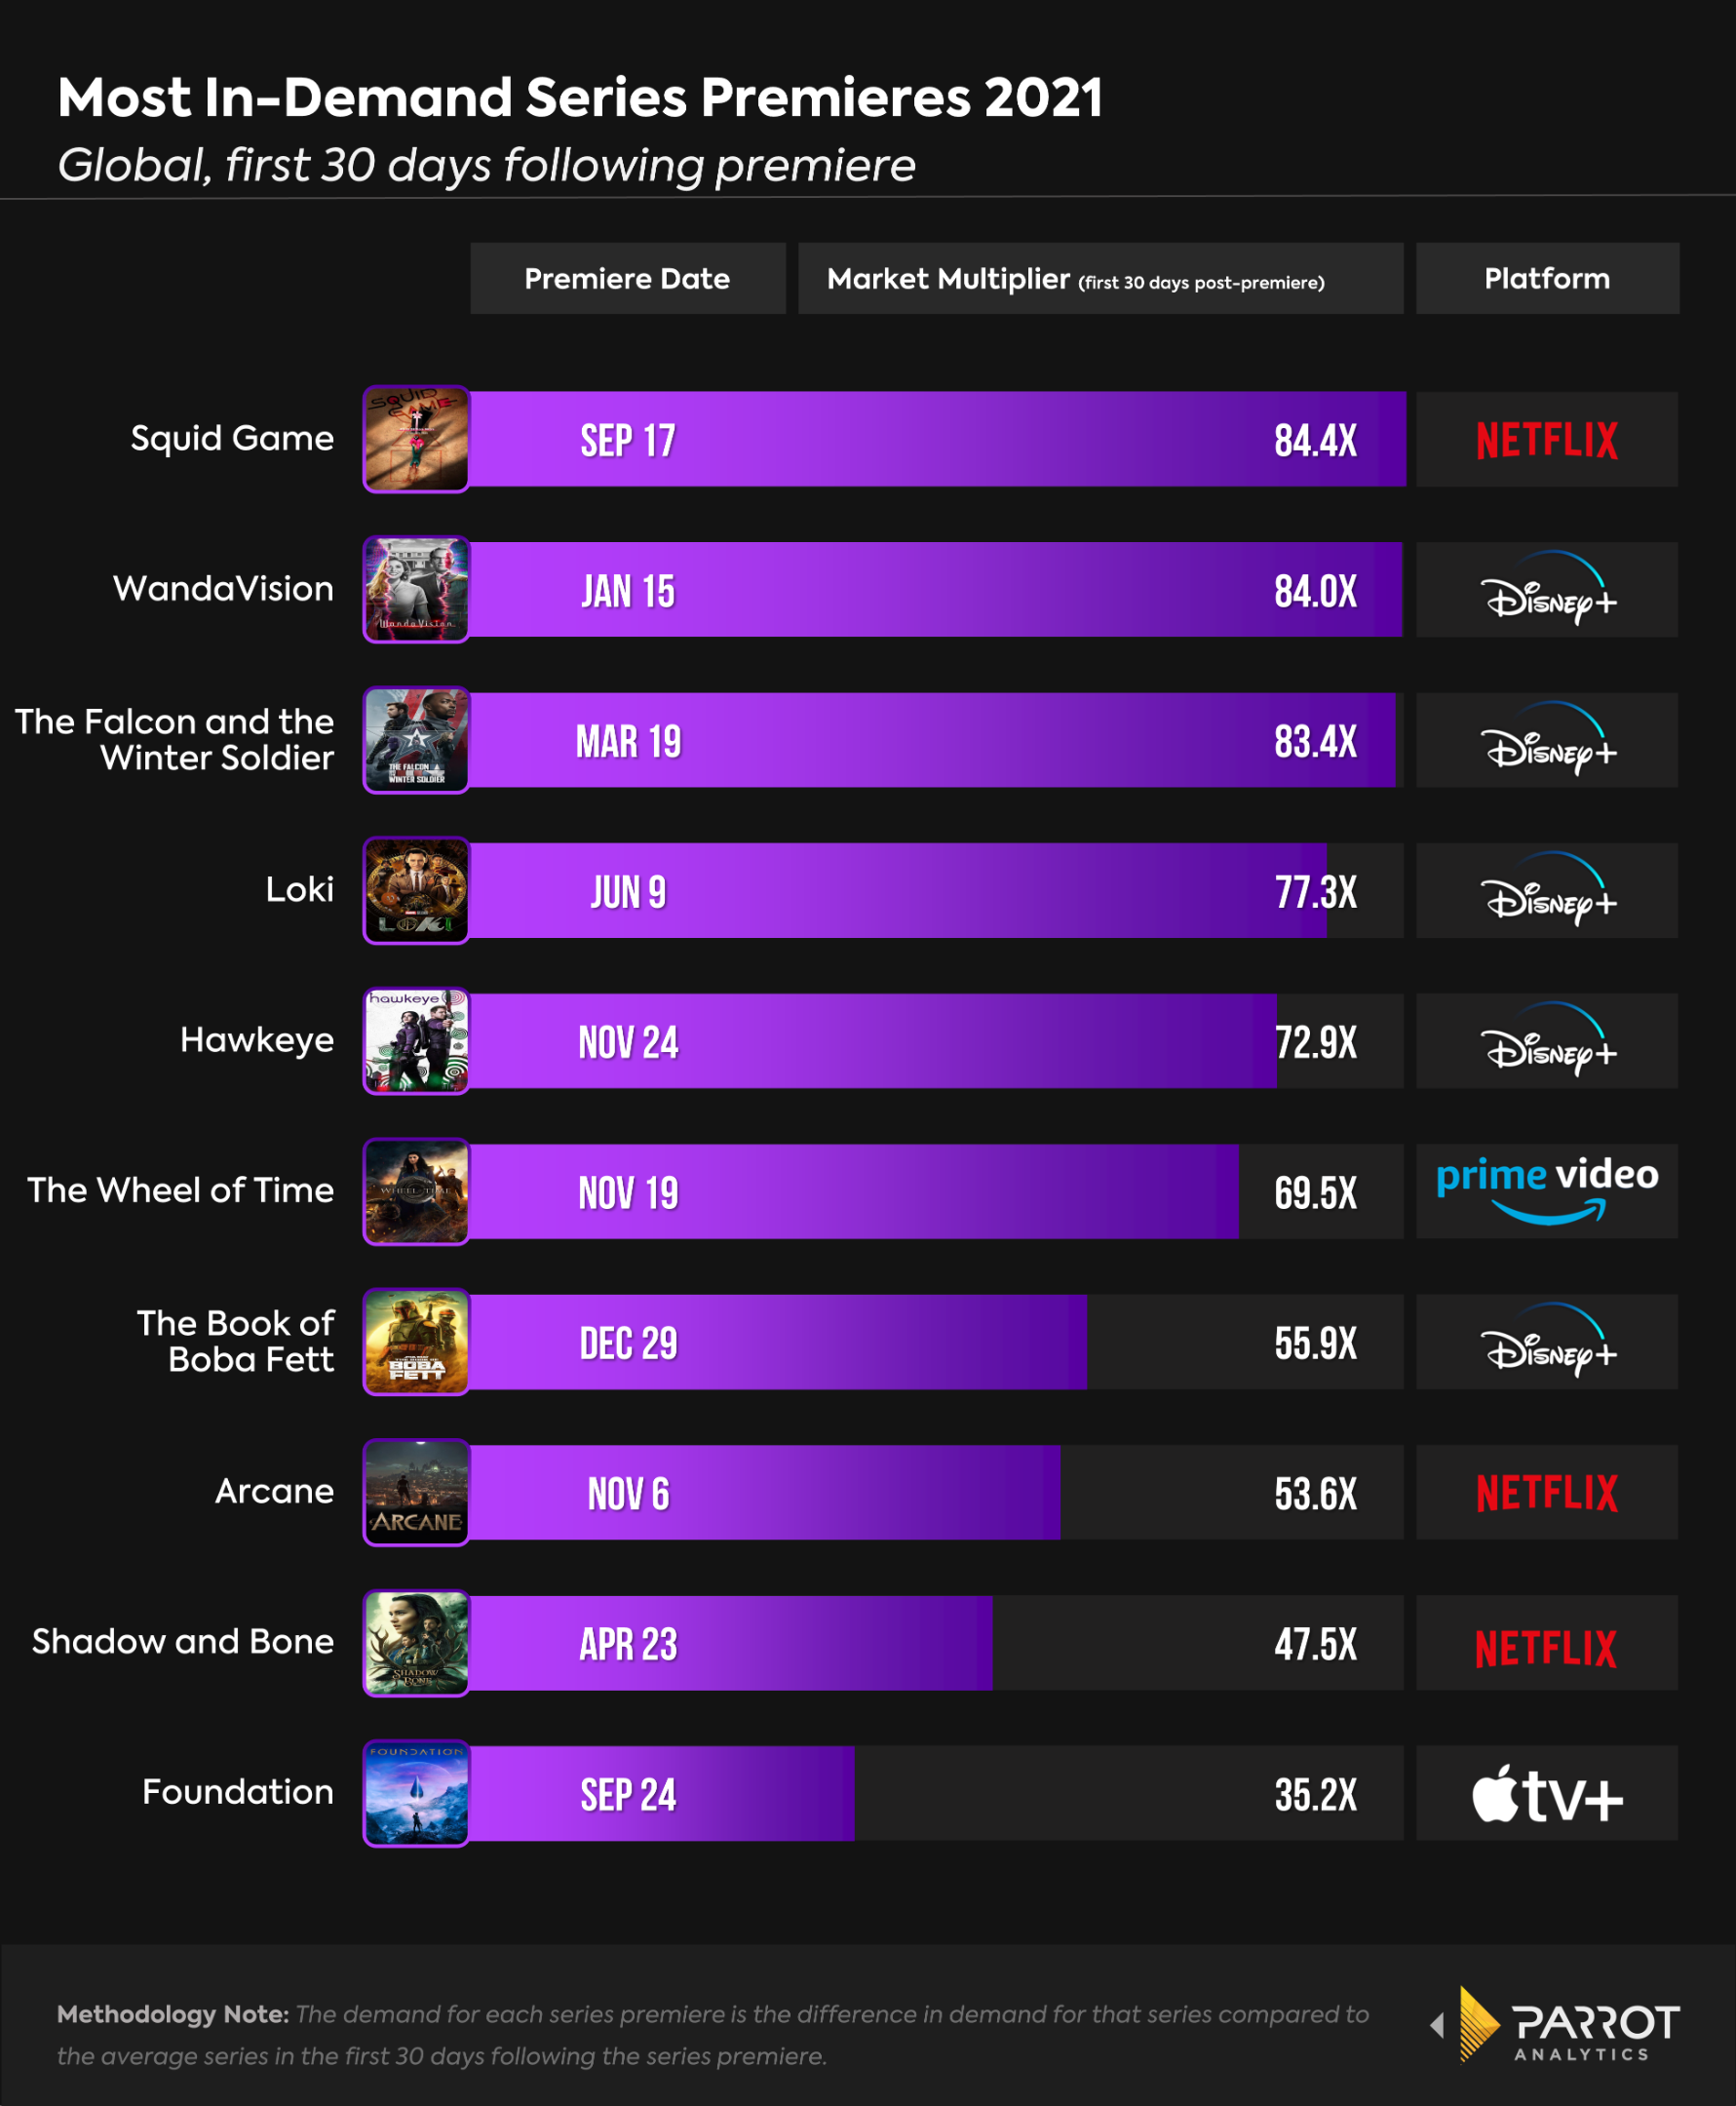
- While there has been chatter during the last year over how Disney+ can grow beyond Marvel and Star Wars, it should be given credit for how consistently successful these series have become.
- Each of the four Disney+ live action Marvel series was among the top five global series debuts of 2021 (greatest average demand in the first 30 days following the premiere), only being beaten out by Netflix’s Squid Game.
- The Mandalorian spin off The Book of Boba Fett was the seventh biggest global debut, meaning Disney+ had 5 of the top ten series debuts across all platforms in 2021.
- This metric matters because demand for original content is a key leading indicator of subscriber growth for SVODs. Quickly generating massive audience demand for a brand new series will thus bring in new subscribers to the platform who previously had no reason to sign up.
