Image: Spongebob Squarepants, Nickelodeon
With the fragmentation of children’s viewing habits across multiple devices – children can consume content not just on TVs but also on phones, tablets and computers – assessing the relative popularity of children’s TV content using traditional methods has never been harder.
A recent survey as reported by Kidscreen states that 58% of children multiscreen, using two or more devices in the form of a tablet, phone, computer or TV – at once. Whilst that survey is for children in Asia-Pacific, the trend likely applies globally.
Another reason this area is complex from a measurement perspective is that social media tracking services, for example, cannot target children: Data privacy laws are far stricter where minors are concerned and so officially at least, children cannot have accounts on most social media platforms.
The measurement of Co-Viewership
Children do talk about the shows they watch with their parents or guardians, however, and particularly for younger children adults will often co-view the show; the same survey linked above also reports that 85% of parents/guardians co-view in Asia-Pacific. These adults then go on to generate online activity about the show: For example, researching suitability using search engines, exchanging show recommendations with other parents on social media, reading about the show on Wikipedia or downloading content to watch for younger children. Obviously, these adults are also the chief purchasers of merchandise relating to each show.
Only Parrot Analytics can track the full range of these online activities, in 100+ major markets globally: By analysing and standardizing weighted data derived from sources including social media chatter about children’s shows, children’s TV show downloads and streaming of episodes, as well as activity on information, blogging, video sharing and TV show rating sites, Parrot Analytics algorithms can accurately assess the demand for children’s content on a global basis.
In this article, we investigate which titles and franchises are currently the most in-demand in three North American markets: The United States, Canada and Mexico.
The top children’s TV titles and franchises in the USA
To identify which shows are currently in demand, we find those that have the highest average demand in the United States between 1st January and 21st March 2018. The graph below contains the most popular titles for 2018 so far:
With the show’s 11th season running currently and a spike in social media demand this quarter after rumors of the show’s cancellation circulated, it is no surprise that long-running title Spongebob Squarepants is the top title in the US.
It also not a shock that the second highest in-demand title is Star Wars Rebels: Fans were hotly anticipating the series finale in early March after it was confirmed that the show’s fourth season would be its final season. Elsewhere, Canada’s PAW Patrol ranked 7th.
The third highest in-demand kids show for the first quarter of 2018 is the French teen superhero show Miraculous: Tales of Ladybug and Cat Noir. The popularity of this title in the US is likely due to the show’s second season becoming available on Netflix.
Children’s content has a far higher incidence of franchises than content for other demographics does. This next graph shows which video franchises are the favorites with kids in the US.
We note, for this study, a franchise is defined as two or more “linked titles”, where at least two are major titles. For example, with only one major title Spongebob Squarepants is not counted as a TV franchise while with two major titles in Penguins Of Madagascar and All Hail King Julien, Dreamwork’s Madagascar is counted as a TV franchise.
Buoyed especially by Star Wars Rebels, juggernaut franchise Star Wars is the leading children’s franchise in the US for 2018 Q1. The runner up is preschool train franchise Thomas & Friends.
Four of the top franchises are not originally from the US: Peppa Pig and Thomas & Friends are British while Voltron and Power Rangers started as adaptions of Japanese shows.
The US franchise list is dominated by franchises that have been around for decades. Of the ten franchises, only Sofia The First (2012) and Peppa Pig (2004) first appeared in this millennium.
Unlike the individual show top ten where nine of the ten titles were aimed at school-age children, for franchises there is a more even split between school-age and preschool content: Four of the ten franchises are primarily for preschoolers.
The top children’s TV titles and franchises in Canada
We now repeat the study for demand in Canada and discover the following results for the top individual children’s titles in this market:
Generally, this is a similar result to the US. The top three titles are the same and in the same order, while overall 7 titles are shared between the US and Canada: Compared to the US, Canadian children prefer Voltron: Legendary Defender, Sesame Street and Mickey Mouse Clubhouse to The Amazing World Of Gumball, Gravity Falls and Star Vs. The Forces Of Evil.
The Canadian franchise demand is also broadly similar to the US. Again, Star Wars is the top children’s franchise with Thomas & Friends second in demand and Teenage Mutant Ninja Turtles third.
Unique to the Canadian top ten are Dreamwork’s Turbo franchise and Canada’s own Degrassi franchise. This makes six of Canada’s top franchises originally American, two Japanese, one British and one Canadian.
The top children’s TV titles and franchises in Mexico
Finally, we examine the top children’s titles by demand in Mexico.
In Mexico, Spongebob Squarepants is only second highest in demand, beaten by strong demand for Star Vs. The Forces Of Evil. Star Wars Rebels also is not in the top three, displaced by Gravity Falls.
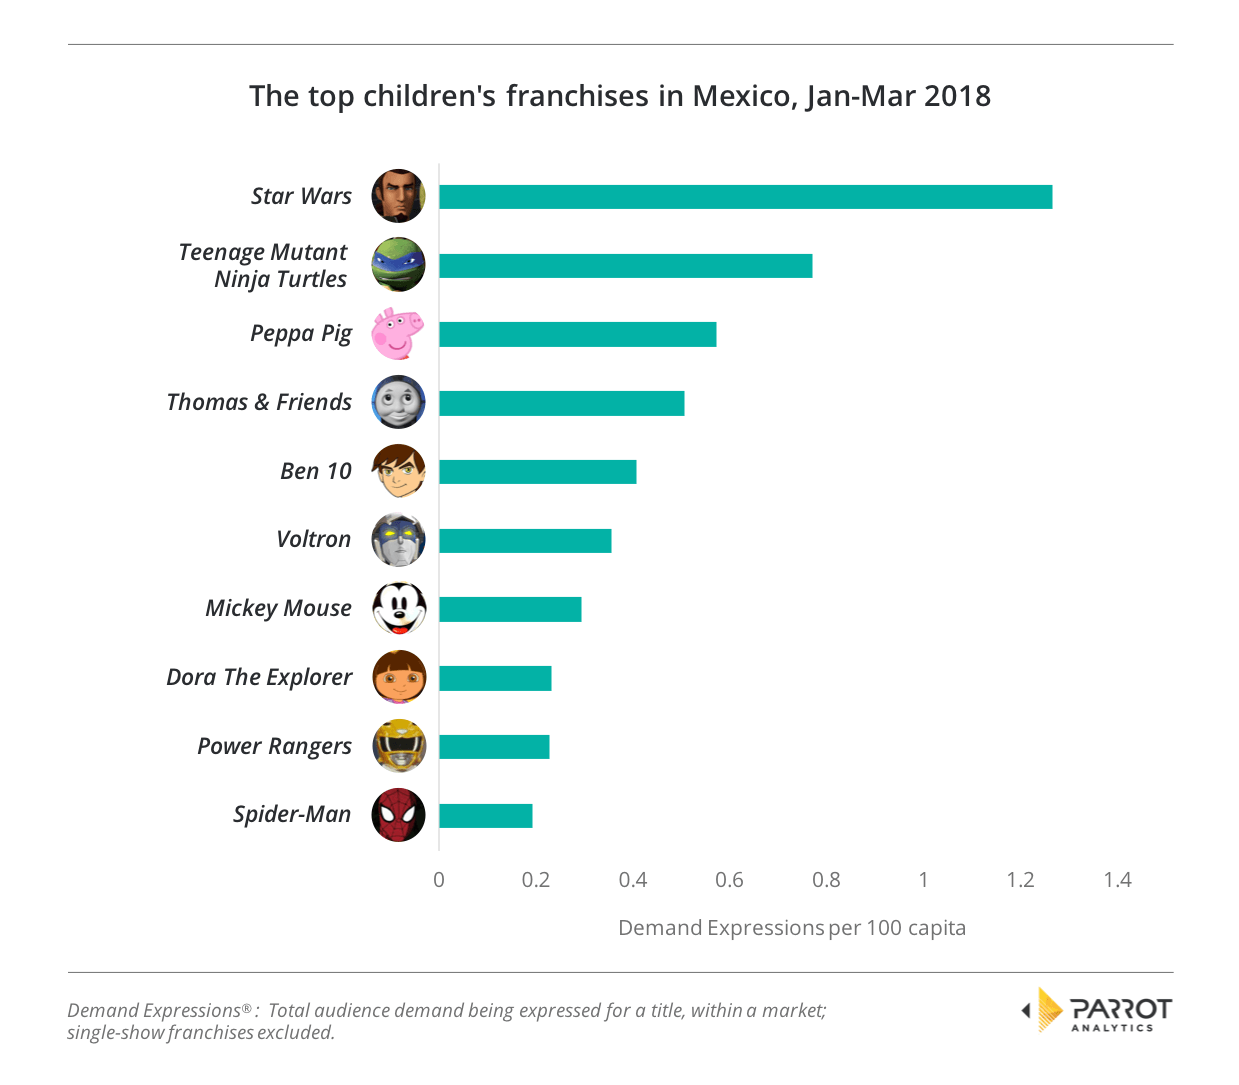
Although Star Wars is still the most in-demand franchise, the list of top Mexican franchises has some differences from the US and Canada.
The globally popular Ben 10 franchise performs best in Mexico where it is the fifth most in-demand children’s franchise. Mexico also rates Dora The Explorer titles higher than the US and Canada do, responding well to the Hispanic main character of the franchise.
Finally, the last franchise unique to Mexico is superhero Spiderman, which is the 10th most in-demand franchise amongst Mexican audiences.
The US is a dominant force in both producing and consuming children’s content in North America.
While it is likely not a surprise that the majority of the most in-demand titles and franchises in these North American markets are US productions, the data reveals another aspect of US dominance.
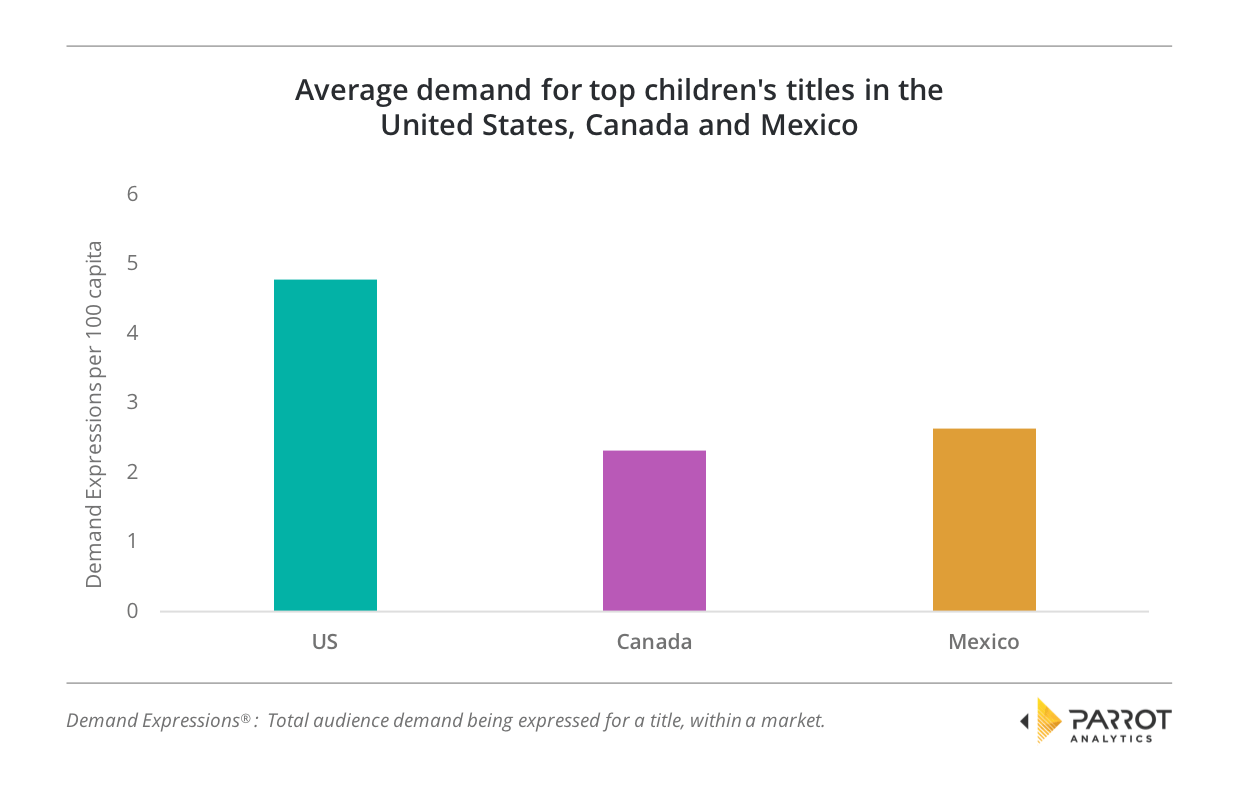
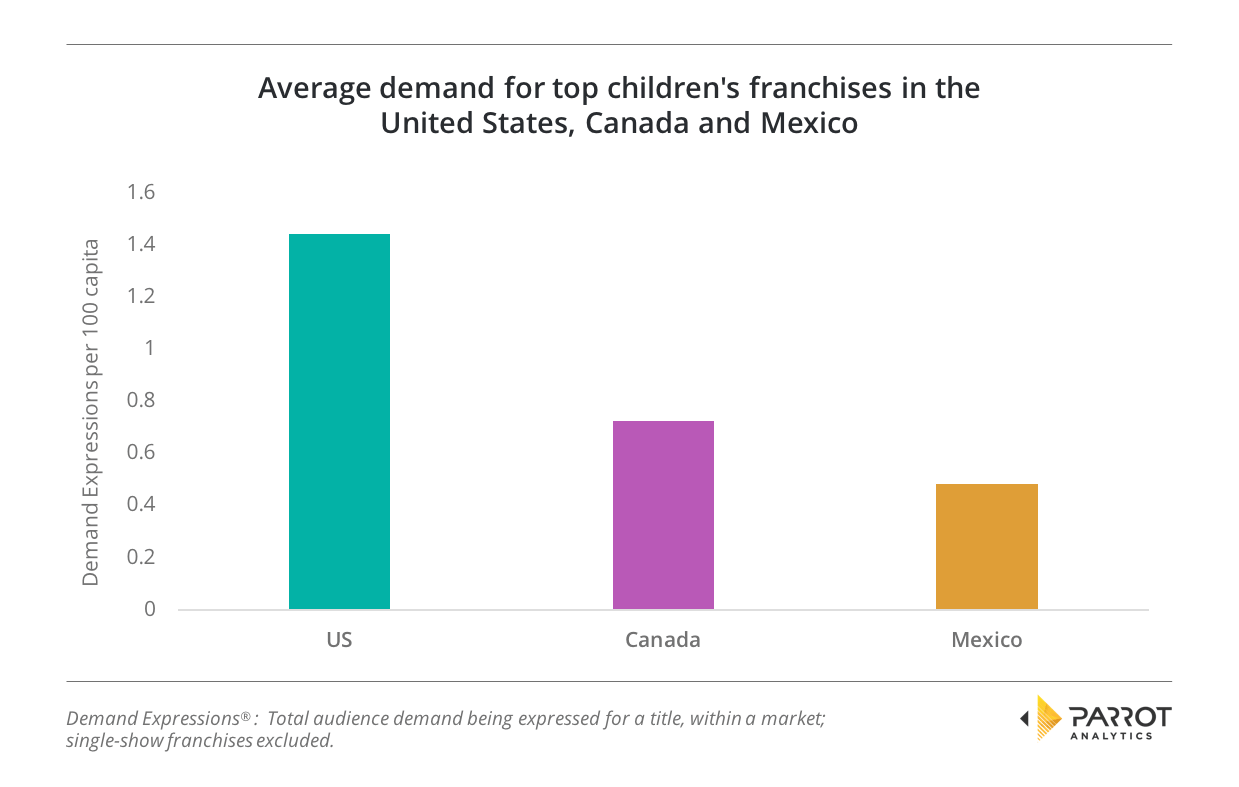
Because demand is normalized by population for each of the top 10 children shows and franchises in each country, we can compare the average of each single title and franchise top ten list across all three markets.
The difference is significant: The average Canadian single title demand is only 49% of the US demand; in Mexico, the average single title demand is 55% of the US demand.
In terms of kid’s franchises, Mexico’s demand average is only 33% of US franchise demand and Canadian franchise demand, in turn, is approximately half of US franchise demand.
As the US not only has the highest demand per capita for children’s content, but is also the biggest of the three markets, its importance to children’s content producers and distributors in the region is unchallenged.
Overall, Parrot Analytics demand data shows that children’s content is reasonably universal across the three markets; the majority of both the individual titles and franchises are shared between at least two.
However, our analysis also highlights that even with the number of shared titles between territories, there are noticeable differences between markets. By understanding country-specific global content demand trends, content sales and distribution teams can enhance their negotiating position and anchor pricing accordingly.


