Image: The Night Agent, Netflix

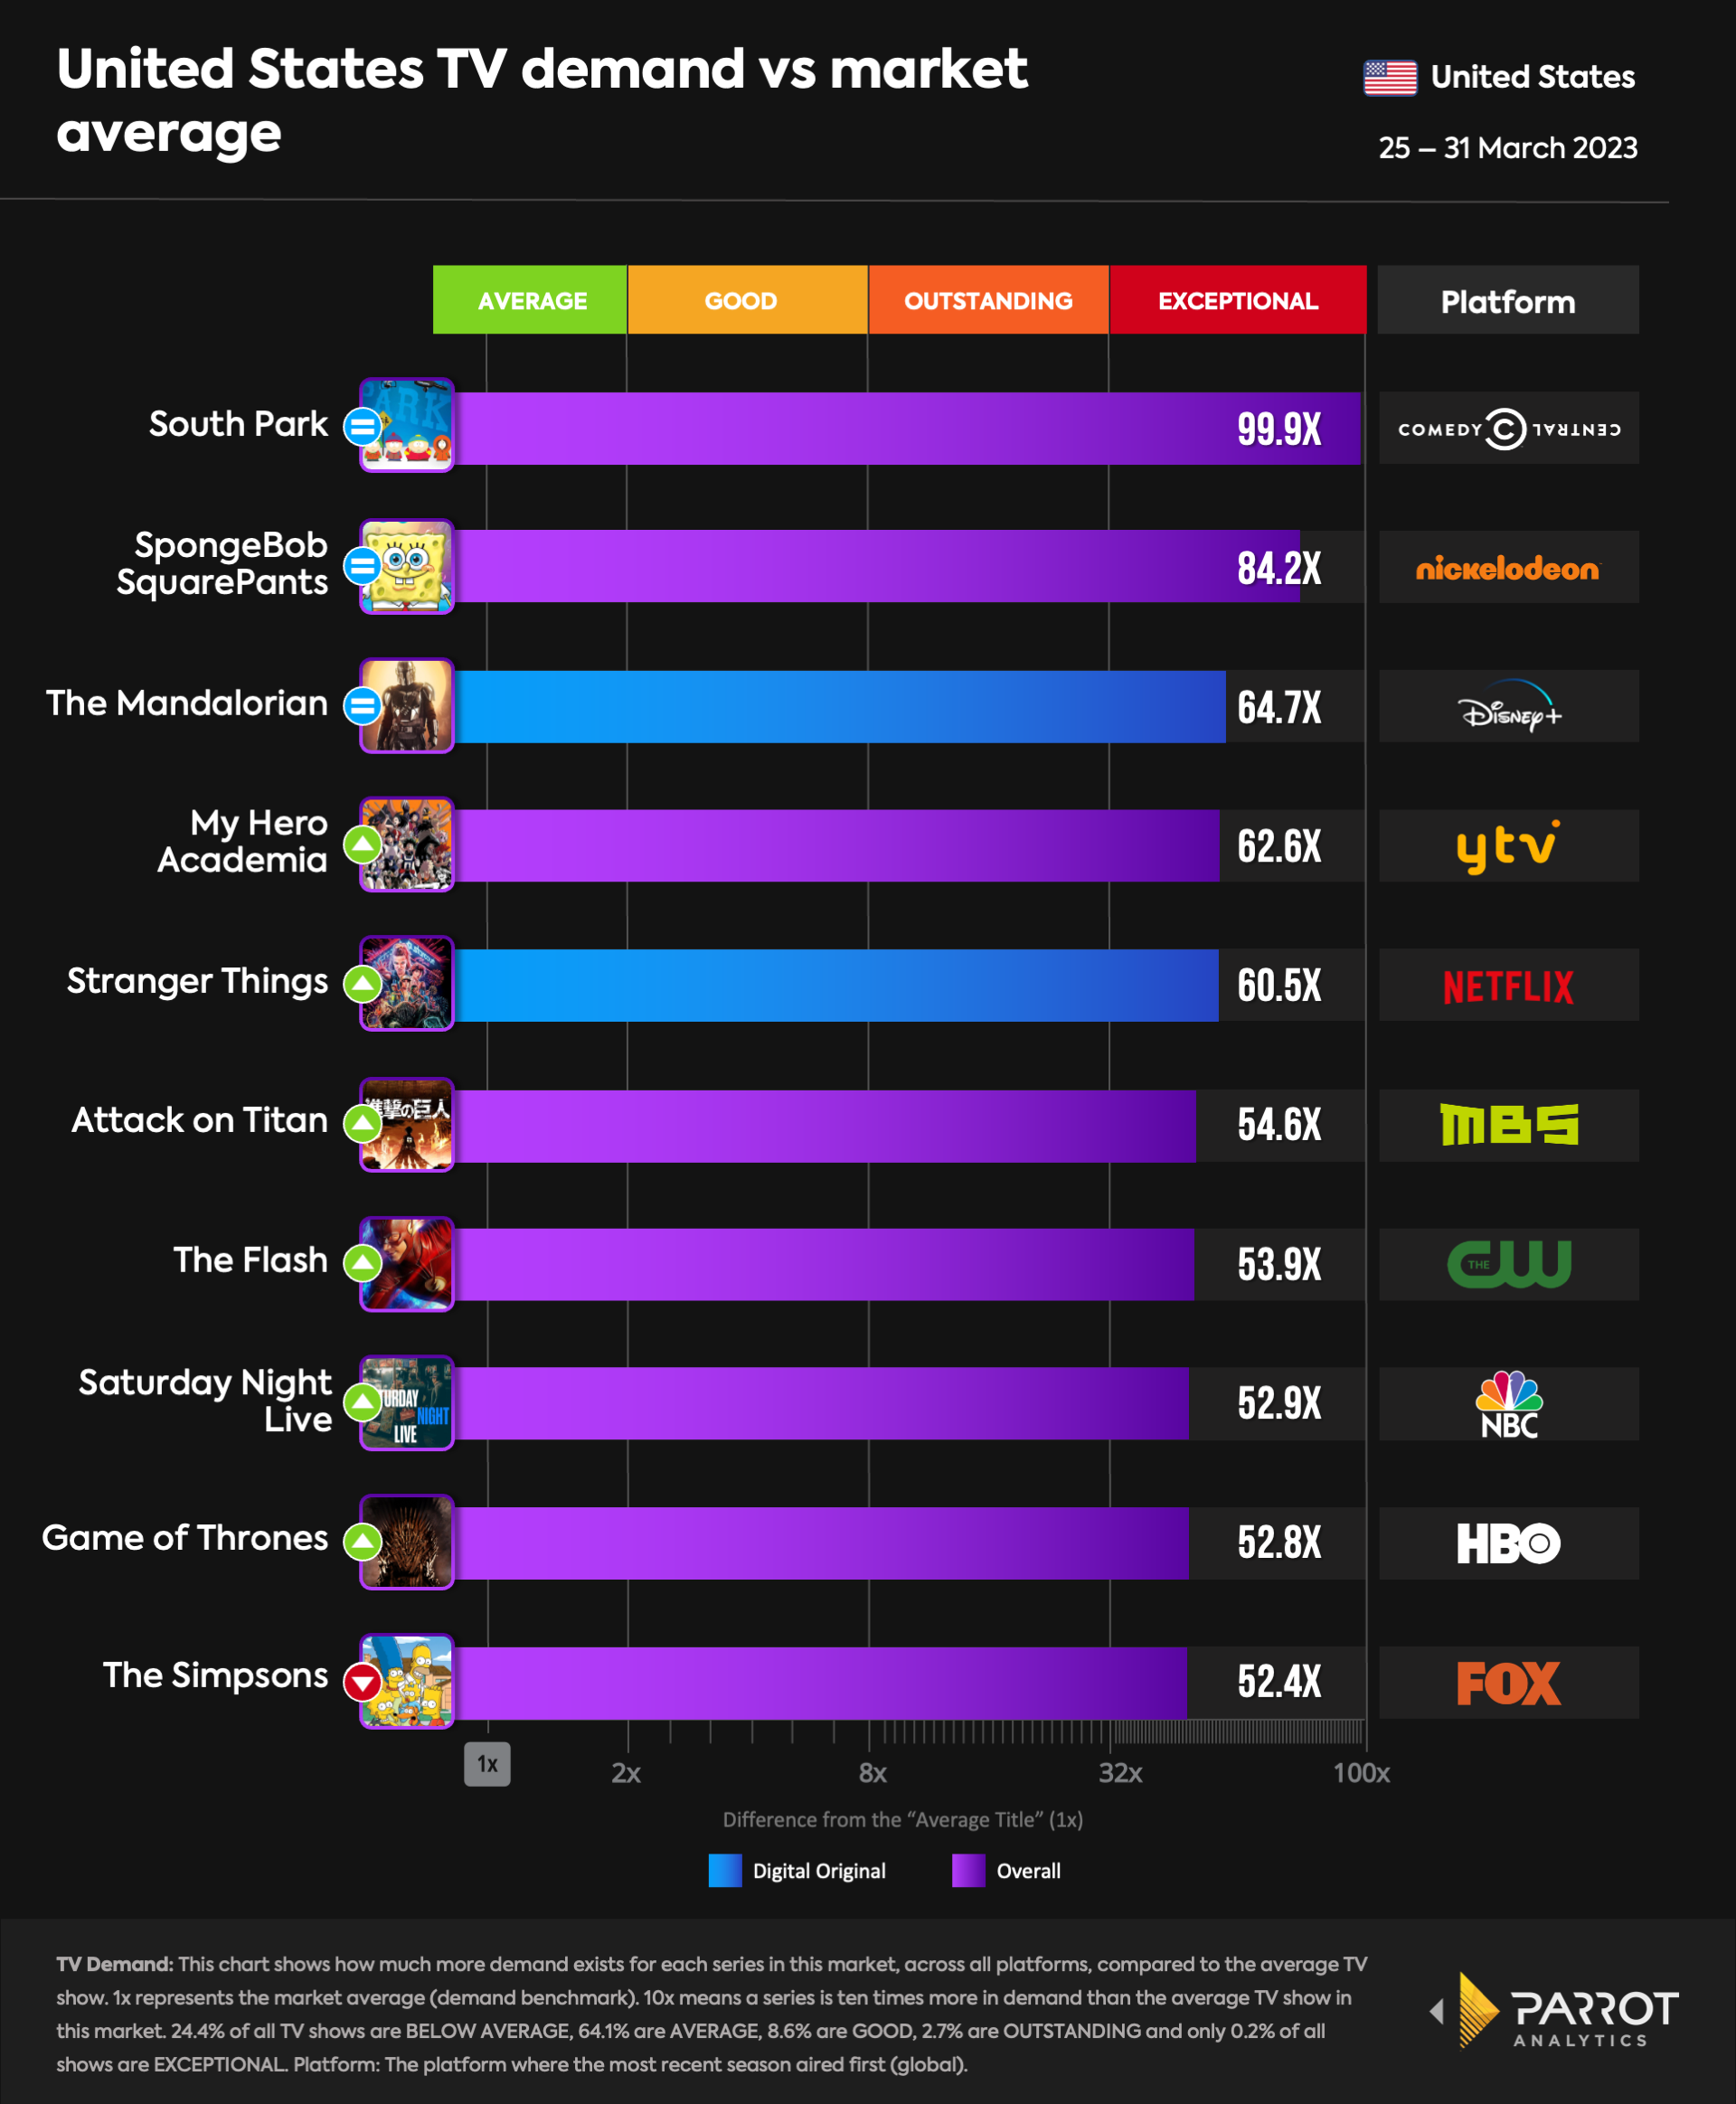
This week 25 - 31 March, all shows in the overall ranking saw a drop in demand with the exception of two series. This trend was interesting to watch, and could be attributed to some big series in the streaming original rankings taking up a big chunk of audience attention in the U.S. this week. We still have South Park at the top of the ranking, albeit with a minor decline which made it 99.9 times more in demand than the average series in the U.S. this week. The shows in second and third place also remained the same this week.
Interestingly, all the other shows moved up the ranking after The Simpsons slid down to tenth place as the result of a significant 15% decline after enjoying two weeks of high audience demand. In tandem, YTV’s My Hero Academia moved up to fourth place in the ranking this week with a minor 2% increase in demand after its sixth season finale aired on March 25. Another anime series, MBS’s ever popular Attack on Titan also moved up the ranking (despite a 9% decline) to take sixth place with 54.6 times the average series demand.
The CW’s The Flash also moved up from ninth place last week to seventh this week despite a minor decline in demand. The show maintained a relatively stable level of demand and had 53.9 times the average this week. NBC’s Saturday Night Live made a comeback in the ranking this week after sliding off last week. The show had a 3% increase in demand ahead of its episode on April 1st, which aired after the sketch comedy series had taken a two week break with the last episode having aired on March 11.

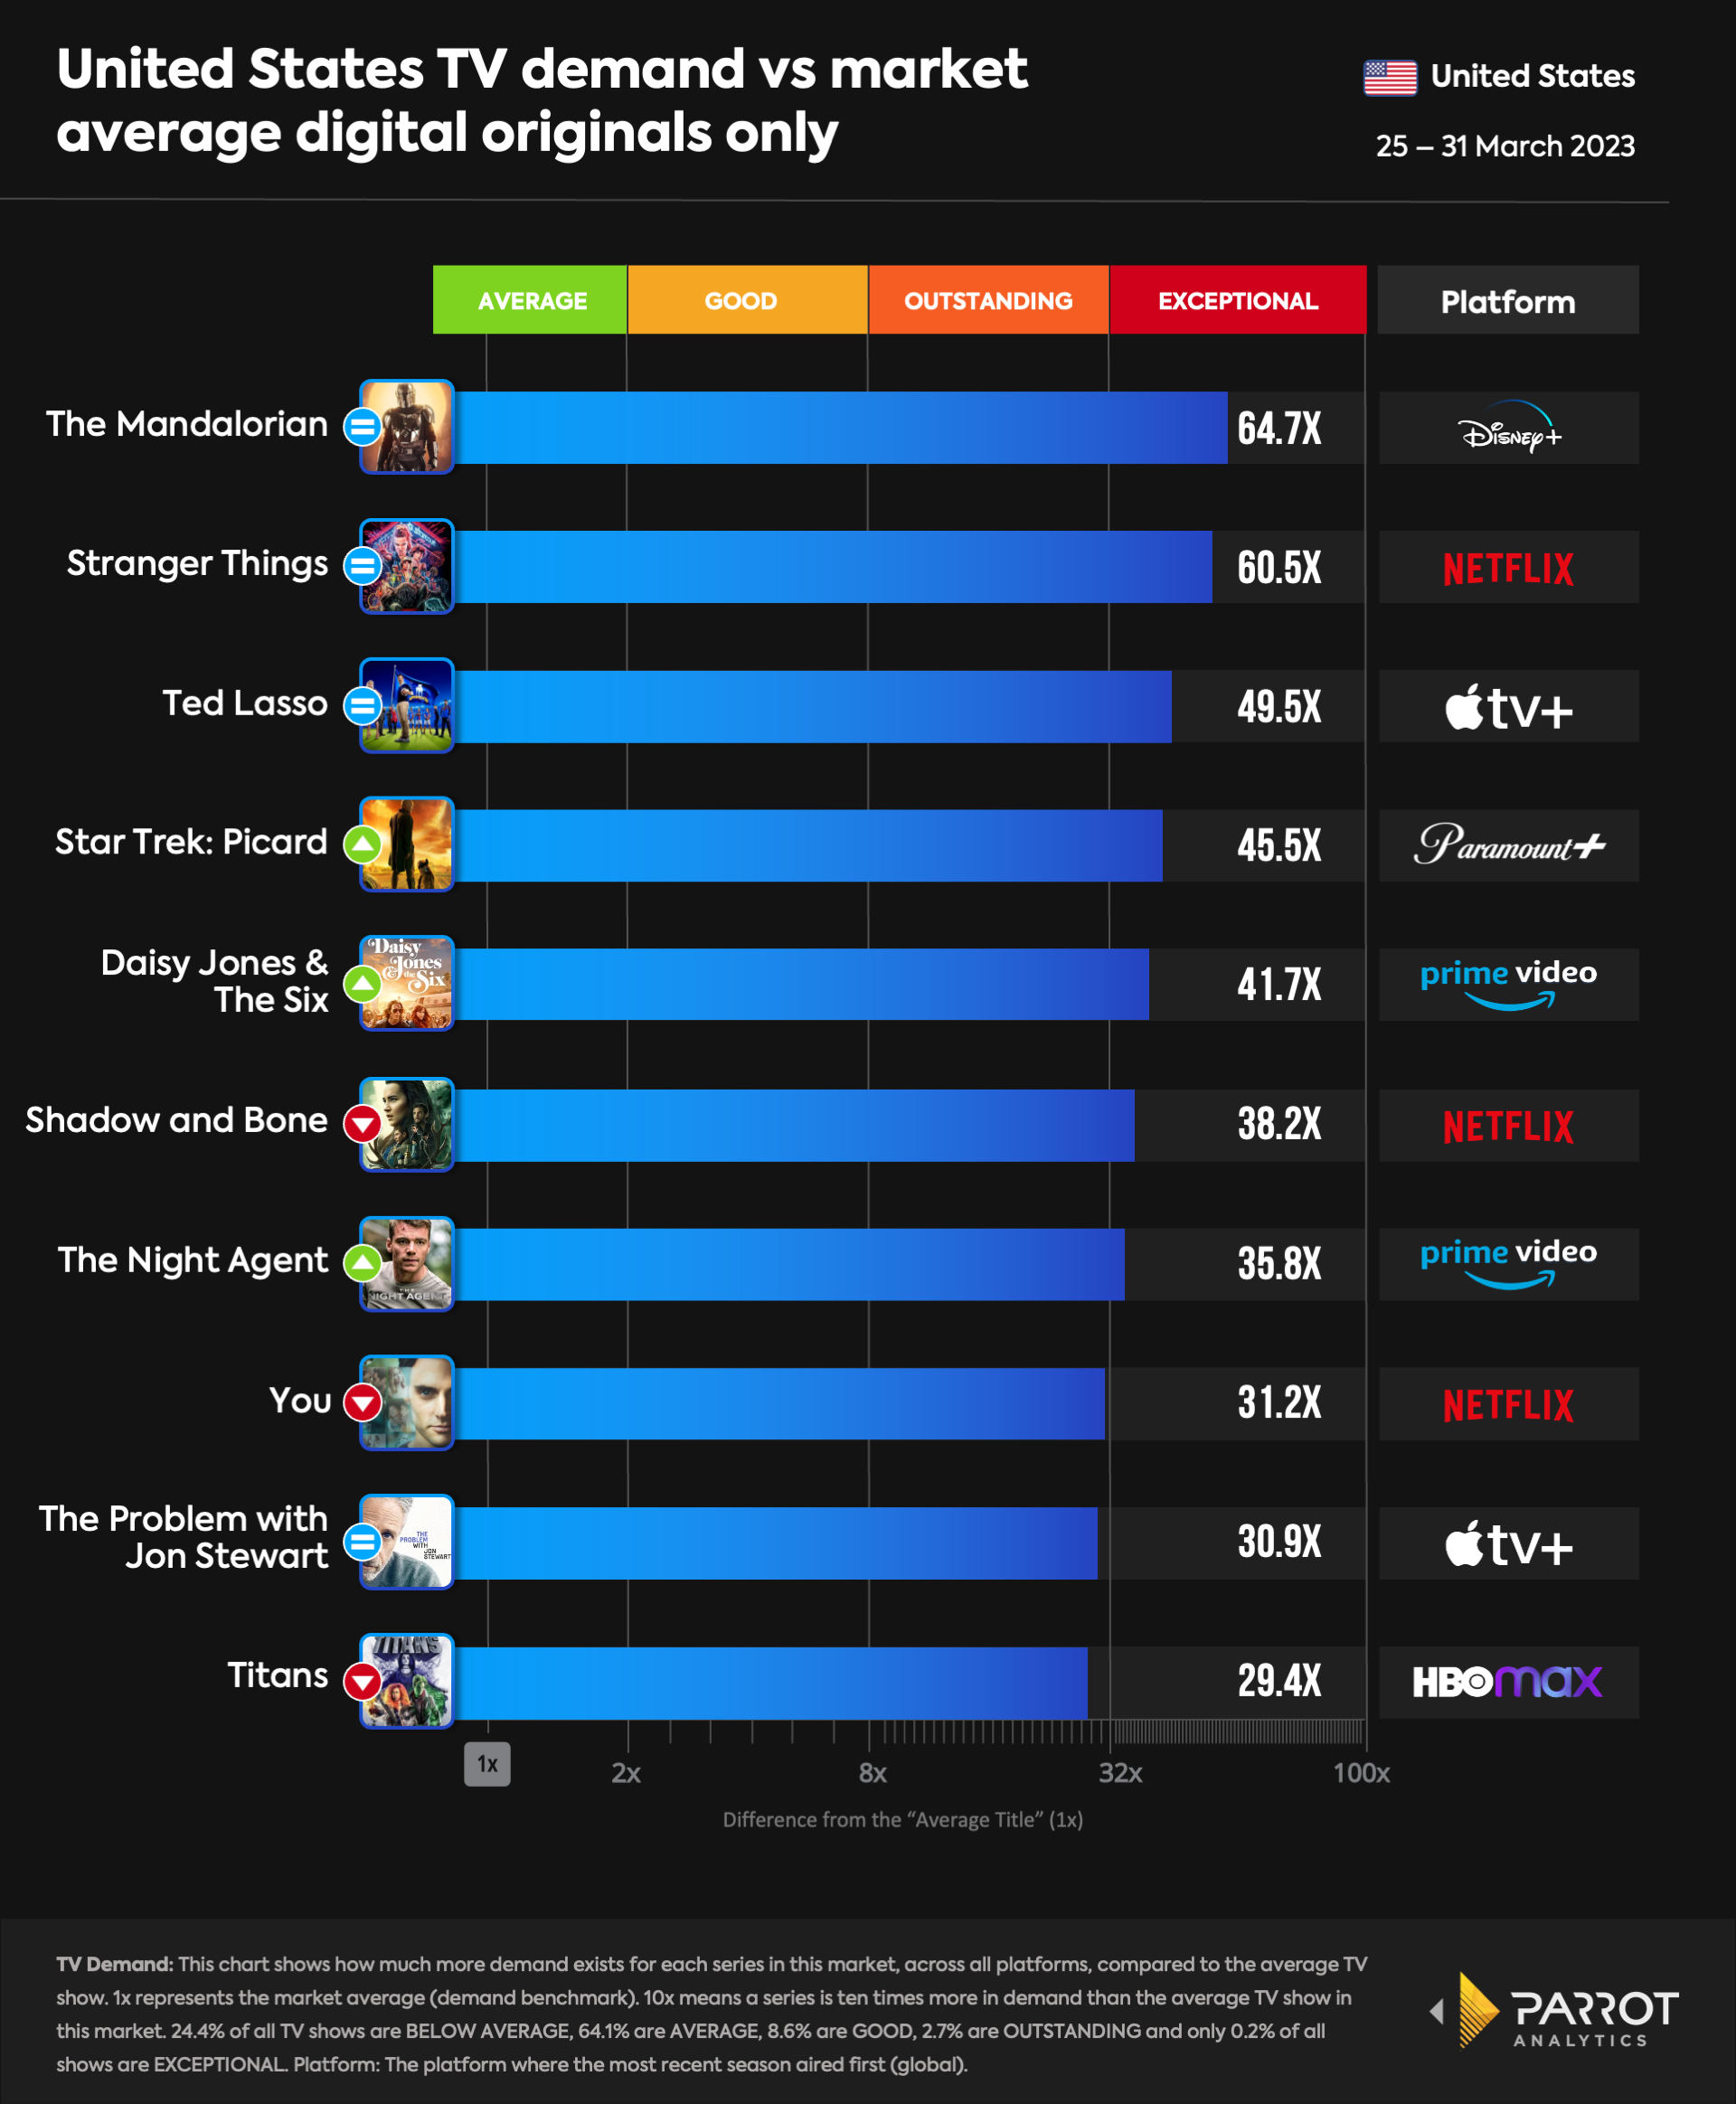
Disney+’s The Mandalorian remained at the top of the streaming original ranking despite a 9% decline which made it 64.7 times more in demand than the average series. It looks like Stranger Things is hot on its heels for first place once again, with the sci-fi show having 60.5 times the average series demand. Apple TV+’s Ted Lasso also retained its position in third place (despite a 6% drop) with 49.5 times the average series demand in the U.S. for the week.
Meanwhile, Paramount+’s Star Trek: Picard enjoyed a minor increase in demand that put it up to fourth place this week with 45.5 times the average series demand. The data indicates that the 3% increase came after the latest episode, which aired on March 30, featured a cameo in its opening moments much to the excitement of fans. Meanwhile, Prime Video’s Daisy Jones & The Six also moved up to fifth place as a result of a 4% increase that pushed it up the ranking with 41.7 times the average demand. The spike in demand observed here came as a result of its finale episode airing on March 24. Considering that Daisy Jones & The Six is a mini-series, it's likely that demand for the show will fall by next week as audience attention moves to other content.
Netflix’s latest political thriller series The Night Agent had the most significant and impressive increase in demand this week - 369%, which probably also explains the decline in demand for other series and minor increases for others as audience attention was diverted to the show. Based on a novel by Matthew Quirk, The Night Agent has had an impressively strong debut week after it premiered on March 23 , becoming the third most viewed debuting series on Netflix and already being green-lit for another season, marking one of the fastest renewal decisions for the streamer. The decision is a great one for Netflix and makes sense given the audience demand for the series - it had 35.8 times the average series demand in the U.S. and entered the ranking to take seventh place this week.


