As ViacomCBS reports its first quarter earnings numbers this morning, Parrot Analytics has unveiled new data, highlighting:
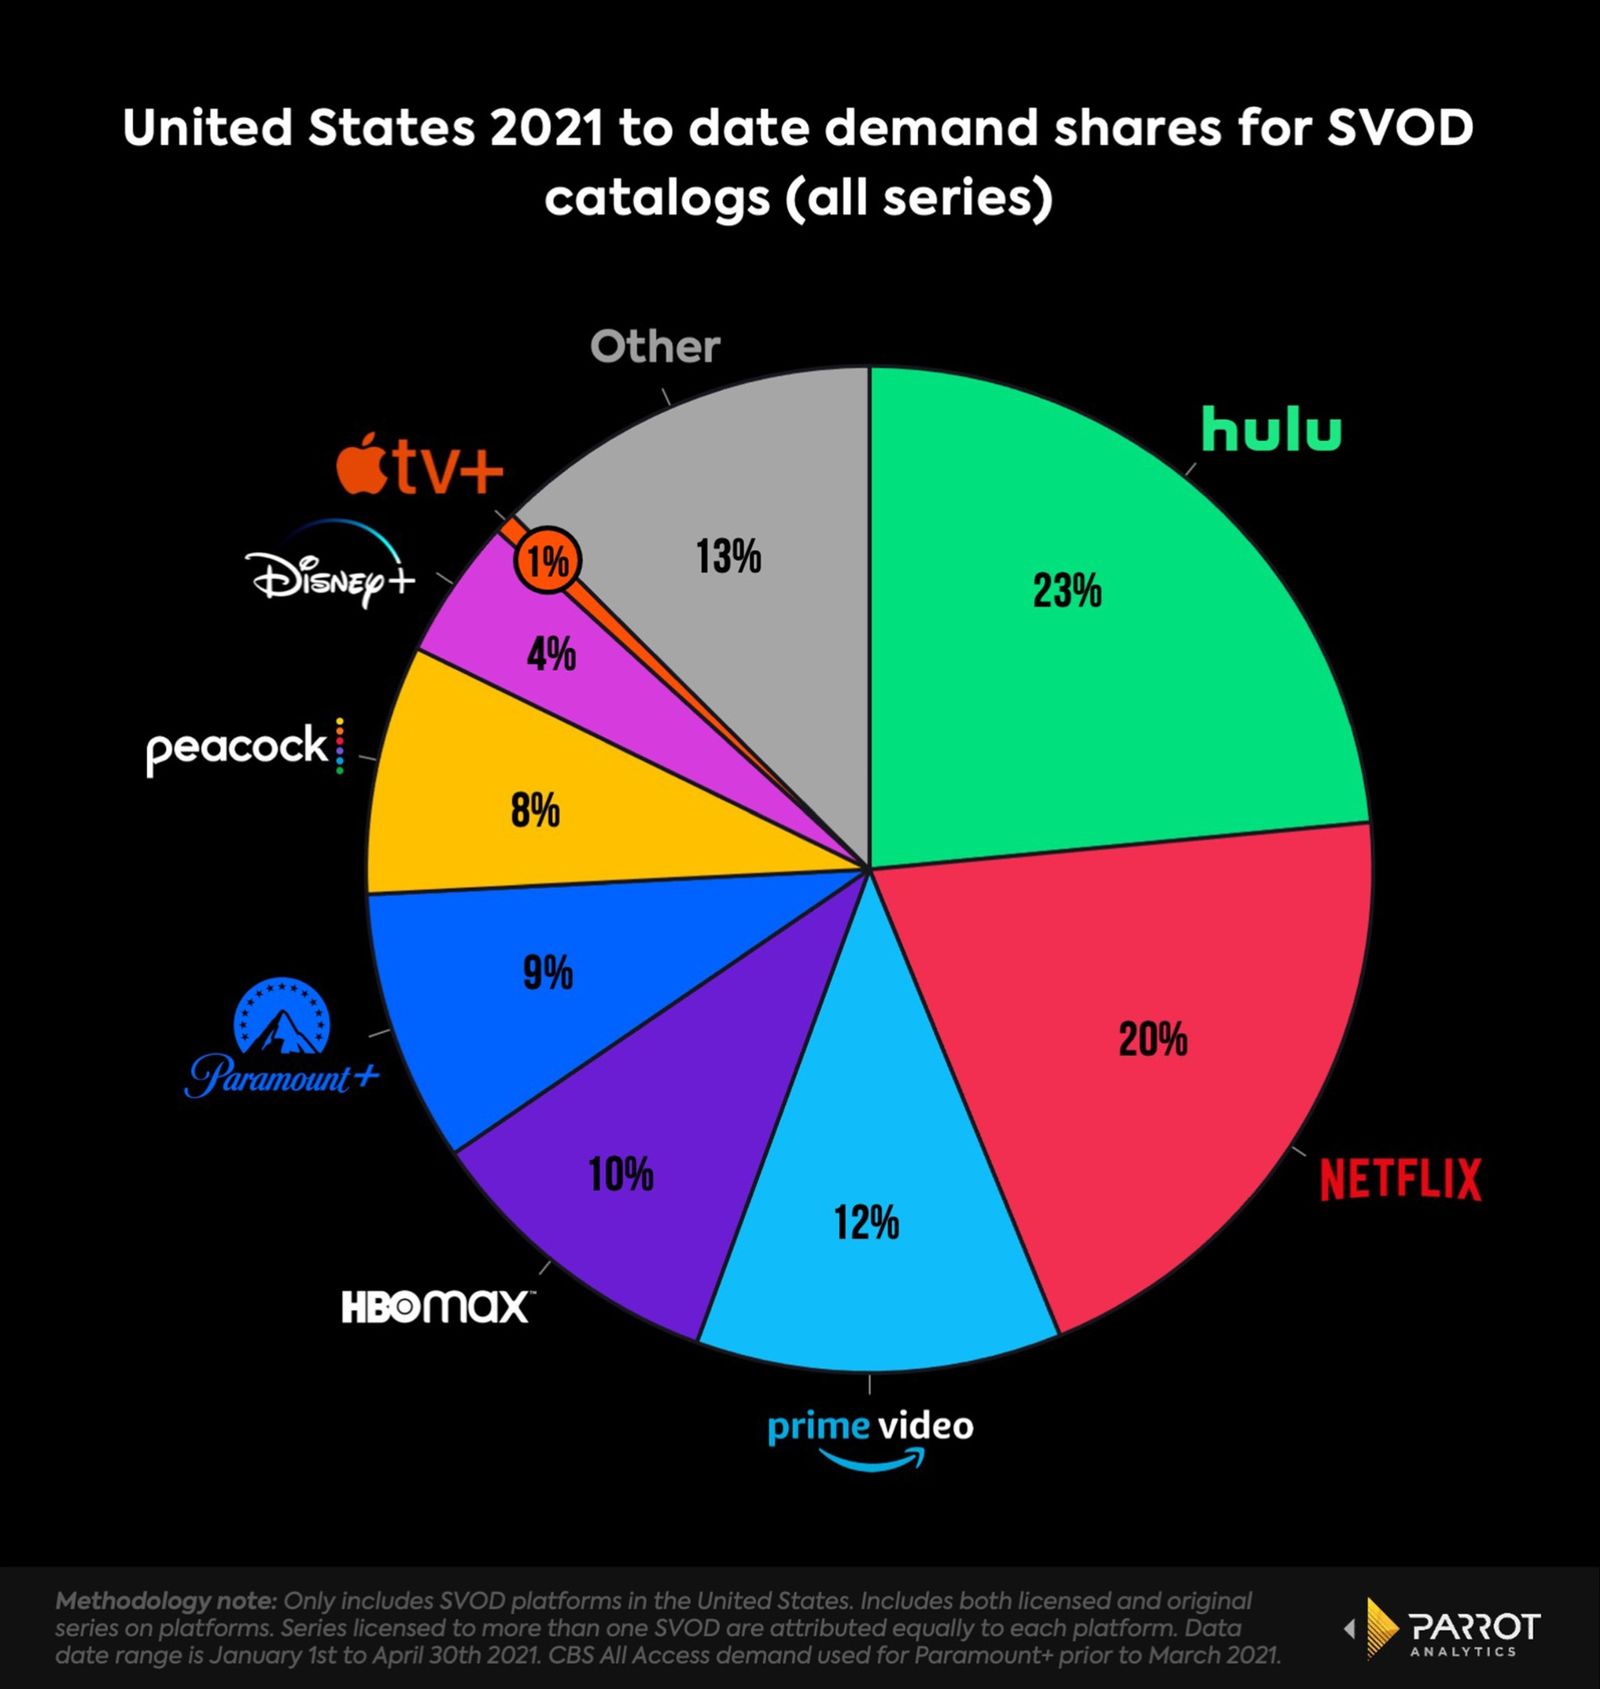
- Demand for Paramount+ content (9%) is in a close race with HBO Max (10%) and Peacock (8%) ahead of ViacomCBS (VIAC) earnings.
- Rebranding to Paramount+ has not yet changed CBS All Access’ standing as a medium-sized player in the United States SVOD market.
- ViacomCBS has deep content reserves to bolster Paramount+.
Below is an in-depth look at how demand for the new platform stacks up against competitors and also how demand for ViacomCBS’s library compares.
Rebranding to Paramount+ has not yet changed CBS All Access’ standing as a medium-sized player in the United States SVOD market


Insights about Paramount+
- CBS’s library of content and the high-demand Star Trek digital original series inherited from CBS All Access give Paramount+ a reasonable mid-level position in the US SVOD market.
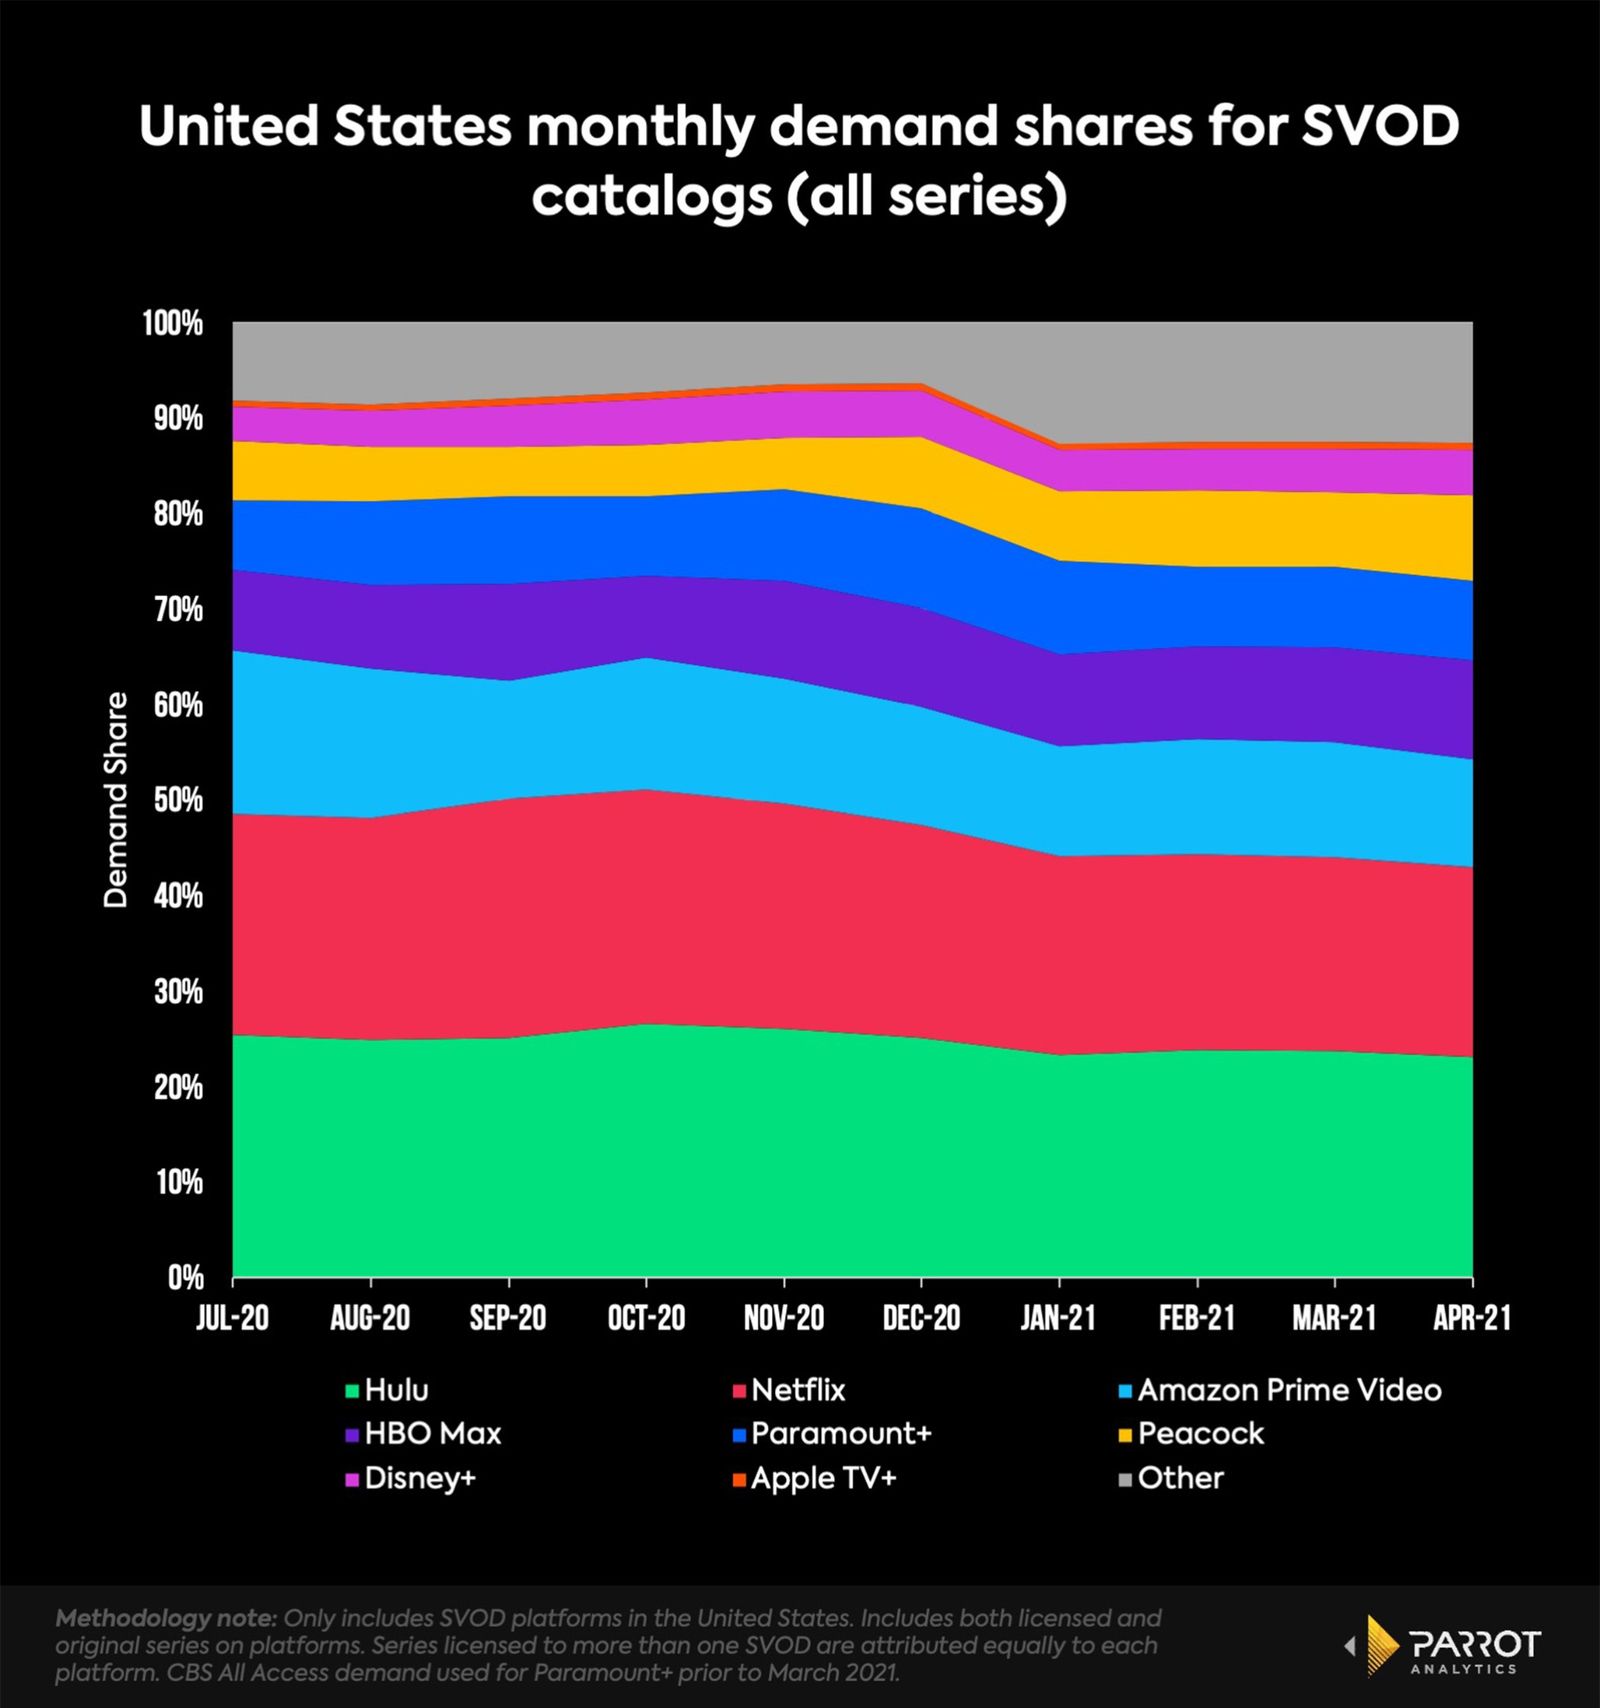
- The Paramount+ US SVOD demand share of around 9% is fairly stable month-by-month.
- The rebrand to Paramount+ in March 2021 did grant a modest boost in demand to the platform, but the relative growth in other SVODs at the same time meant this held the demand share steady rather than leading to an increase in absolute terms.
- Note that prior to Paramount+’s launch in March 2021, the demand shown is for CBS All Access.
Insights about the United States SVOD market
- Over 2021 to date, the full Netflix catalog of original and licensed series accounts for around 20% of US demand for SVOD services. Netflix consistently has the highest demand share for SVOD original series in the US, typically around 40-50%. However, the ongoing loss of licensed content to competitors reclaiming content for their own services may explain the downward trend for the overall Netflix demand share.
- The large amount of highly in-demand library/licensed content available on the Hulu platform leads it to have the largest slice of demand for SVOD services in 2021 so far.
- Disney’s majority ownership of Hulu combined with the market’s appetite for the much newer Disney+ service means the company is the largest entity in the US SVOD market, based on US audience demand.
- Apple TV+ typically has around 4-5% of the demand share for US digital original series, but their originals-only strategy leads to less than 1% share of demand of the overall US SVOD market.
- The HBO Max streaming service seems to occupy the same niche as the HBO cable channel, with a smaller number of highly demanded premium series. This now includes tentpole superhero original series from the DC Universe service, which merged into HBO Max early in 2021. This strategy has secured a comfortable 10% demand share, placing it just ahead of Paramount+ so far this year.
- The market is continually changing as new services launch, with many recent SVODs concentrating on specialist niches. This increase in competition can be seen in the growth of demand for the “Other” category over time.
ViacomCBS has deep content reserves to bolster Paramount+
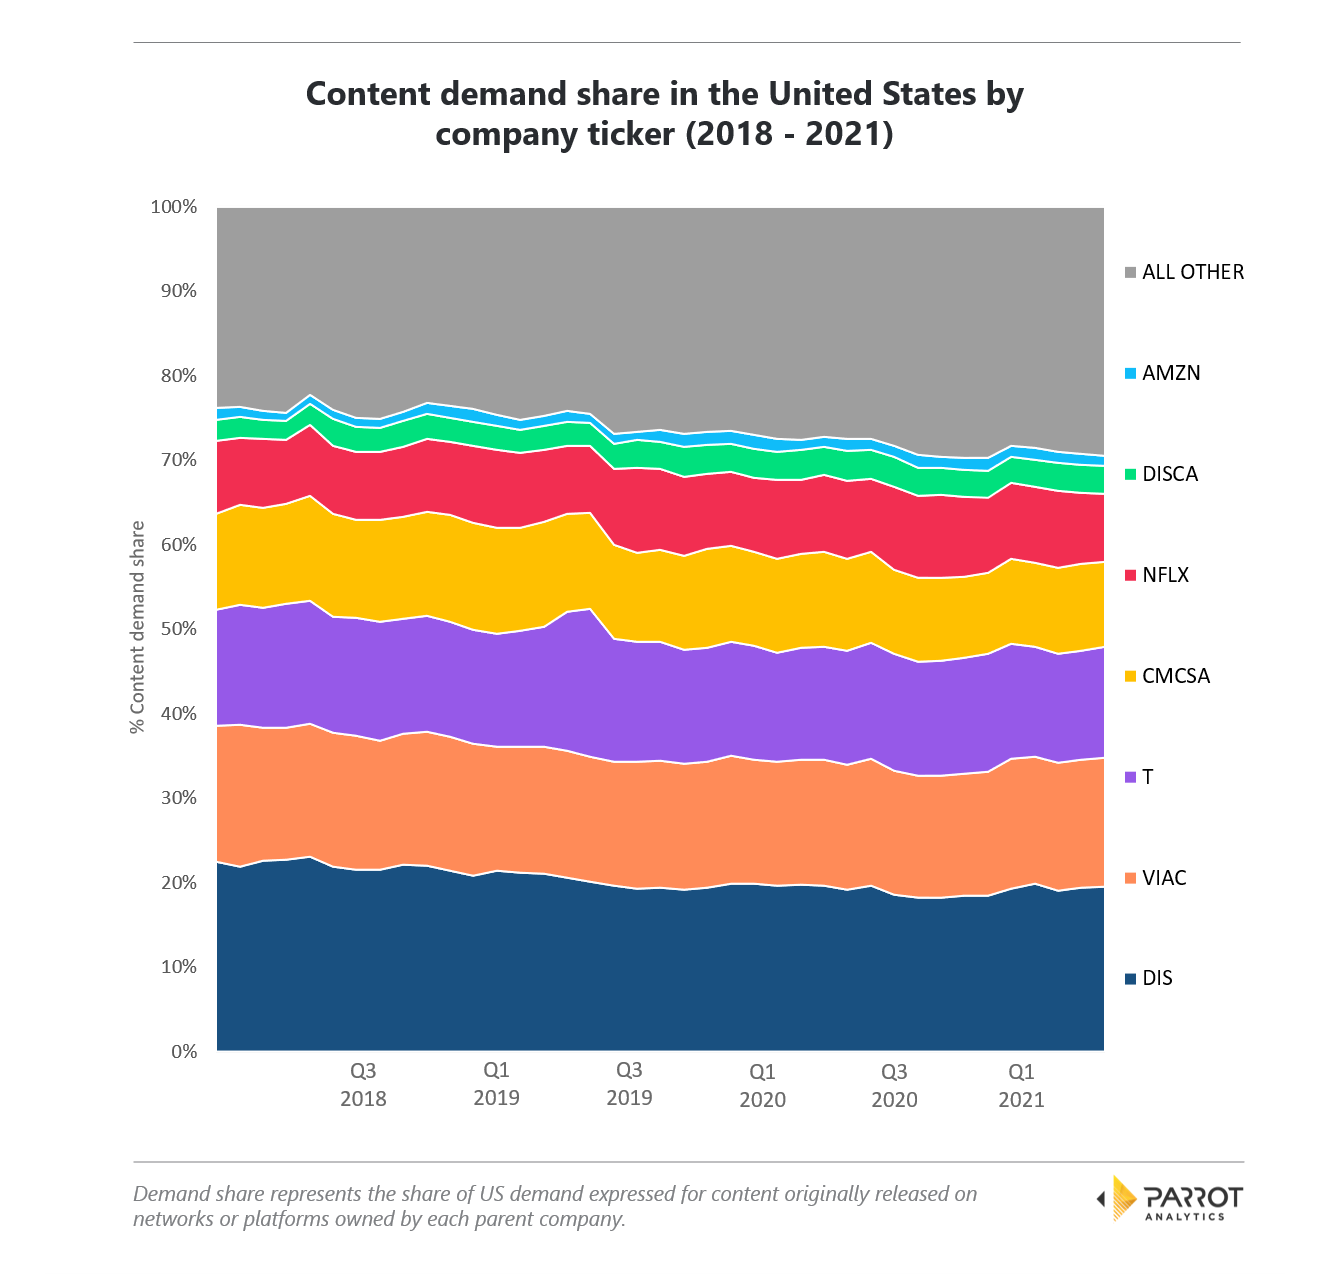
While Paramount+ has not caught up to some of its more established streaming rivals in terms of demand for content available on-platform, the below chart is a good reminder that ViacomCBS and its subsidiaries produce an enormous amount of content.

- The total demand for content originally available on a ViacomCBS property was second only to Disney as of Q1 2021.
- Prior to the merger of Viacom and CBS at the end of 2019, each of those companies ranked behind Netflix in terms of demand share. The marriage of these companies’ programming assets catapulted the new company ahead of AT&T, Comcast, and Netflix in terms of total US series demand.
- This robust demand bodes well for the future potential of Paramount+ as it begins to capitalize on this deep catalog of content. It should also give pause to other platforms who may have been licensing these shows to attract and retain their own subscribers.
- Finally, similar to the growth in demand for content on smaller platforms, there has been growing demand for content owned by other companies (not broken out and marked as “All Other” in the chart). This is driven in part by non-legacy media companies beginning to produce in-demand content, for example Apple.


