The 68th Primetime Emmy Awards ceremony was held on September 18th, recognizing the best in television over the last year. While some major titles repeated their success—Game of Thrones and Veep won Outstanding Drama and Comedy for the second year in a row—others found their first victory this year. The breakout winner was The People v. O.J. Simpson, which picked up five major awards at the ceremony, including Outstanding Limited Series, Outstanding Writing for a Limited Series, and three acting awards. High-profile series like The People v. O.J. Simpson may have been expected to win at least a few of their nominations, but other winners, such as Tatiana Maslany for Orphan Black, were a surprise to both the audience and the honorees themselves.
When the nominations were announced in July, we ranked the series in each category by demand. We will first compare the winners to this ranking to see if the most in-demand series had an advantage. While only the nominees in the overall title category were ranked, we have observed that wins in the acting, writing, and directing categories also impacted demand for their show. Which type of series enjoyed the greatest boost to their popularity post-Emmy win?
In July, the nominees for the best series were ranked by their popularity during their latest, Emmy-eligible season. Now that the winners can be identified, we reproduce the rankings (including the variety series) here with the victorious title highlighted:
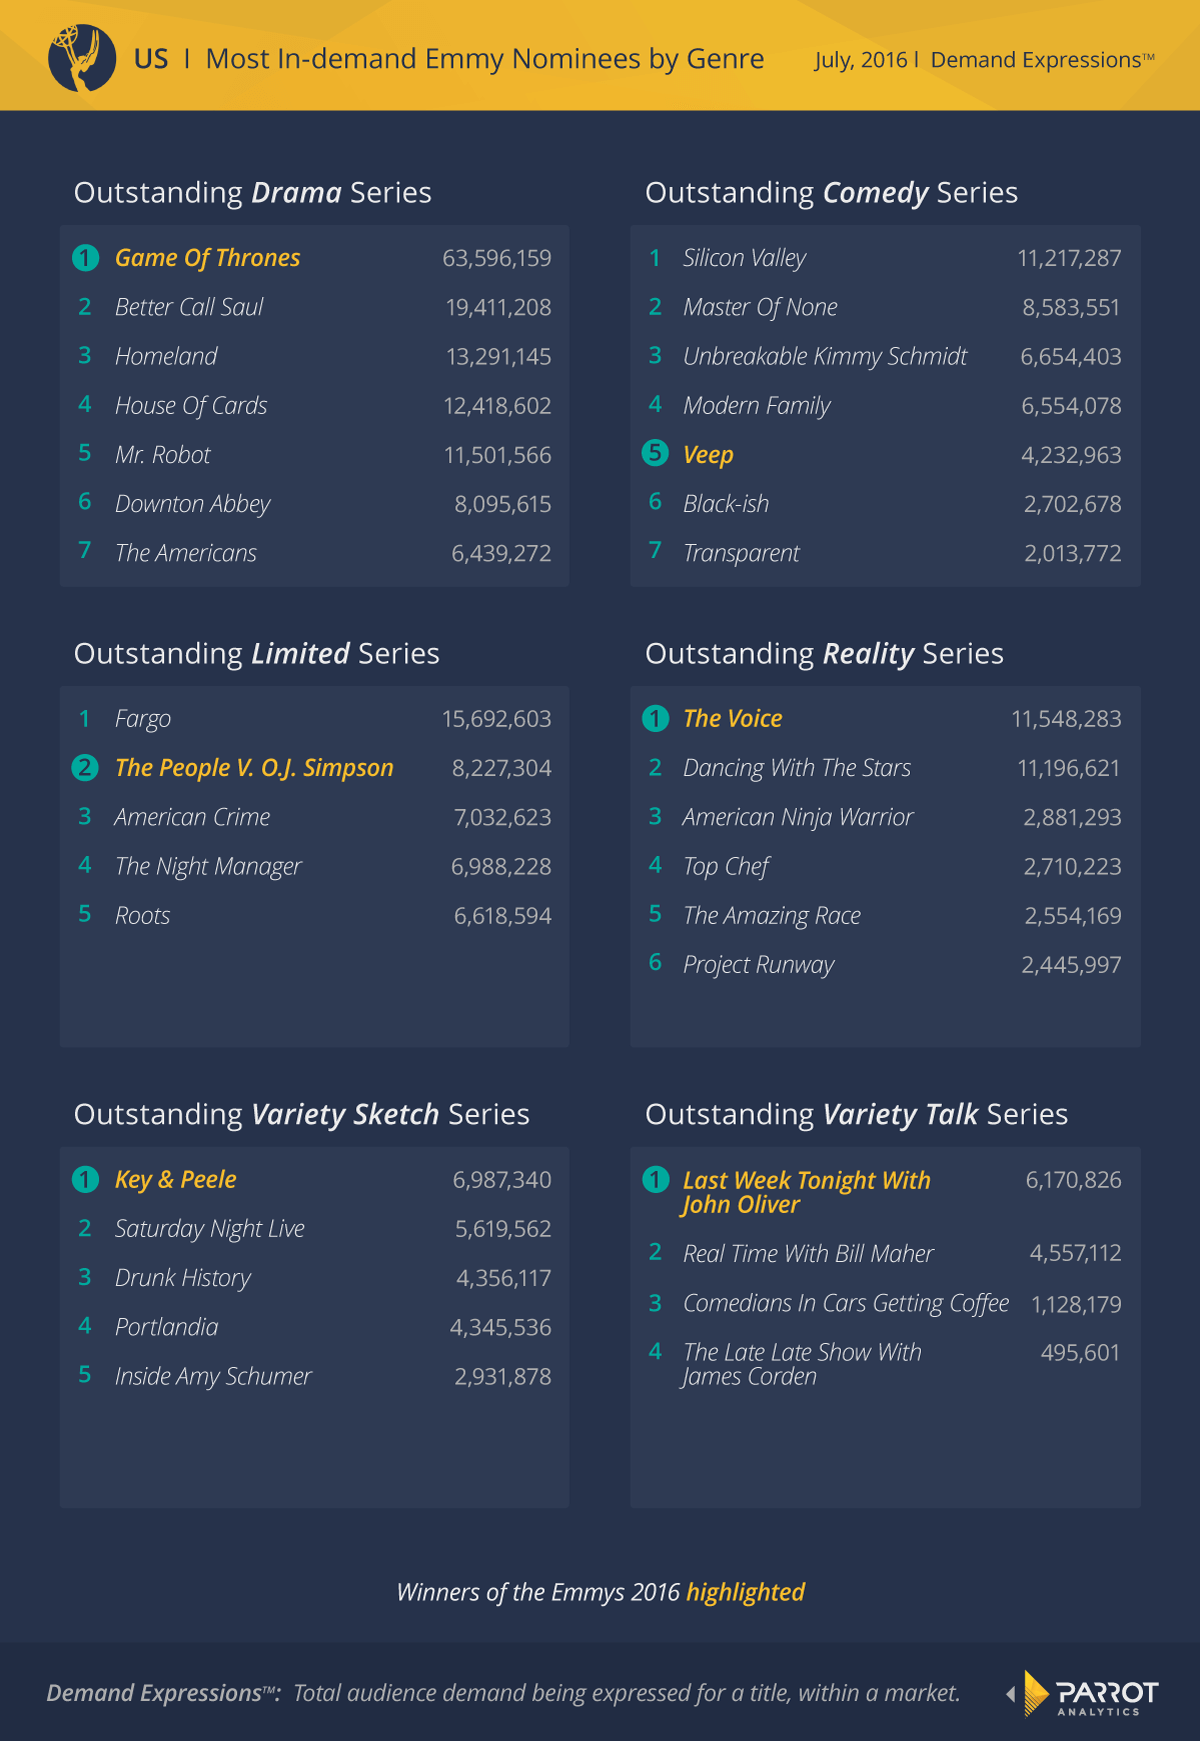
While the previous report stated that “demand is not necessary to win,” it appears that popularity certainly helps. In four out of the six categories, the title which was most in-demand during its latest season won. For the limited series, The People v. O.J. Simpson was second only to Fargo. While Veep had only a third of the most popular comedy’s demand, its win last year made it the incumbent in this category. The most popular show may not always win (The Amazing Race has won 13 times) but this year demand turned out to be an excellent predictor of the winners.
The winners for Outstanding Series may have had the most demand during their run, but which winning shows benefitted most in terms of popularity? To see the effect of winning on individual titles, the Demand Expressions™ for the series which won overall and those that won for acting, writing, and directing are plotted for the week before and after the ceremony.
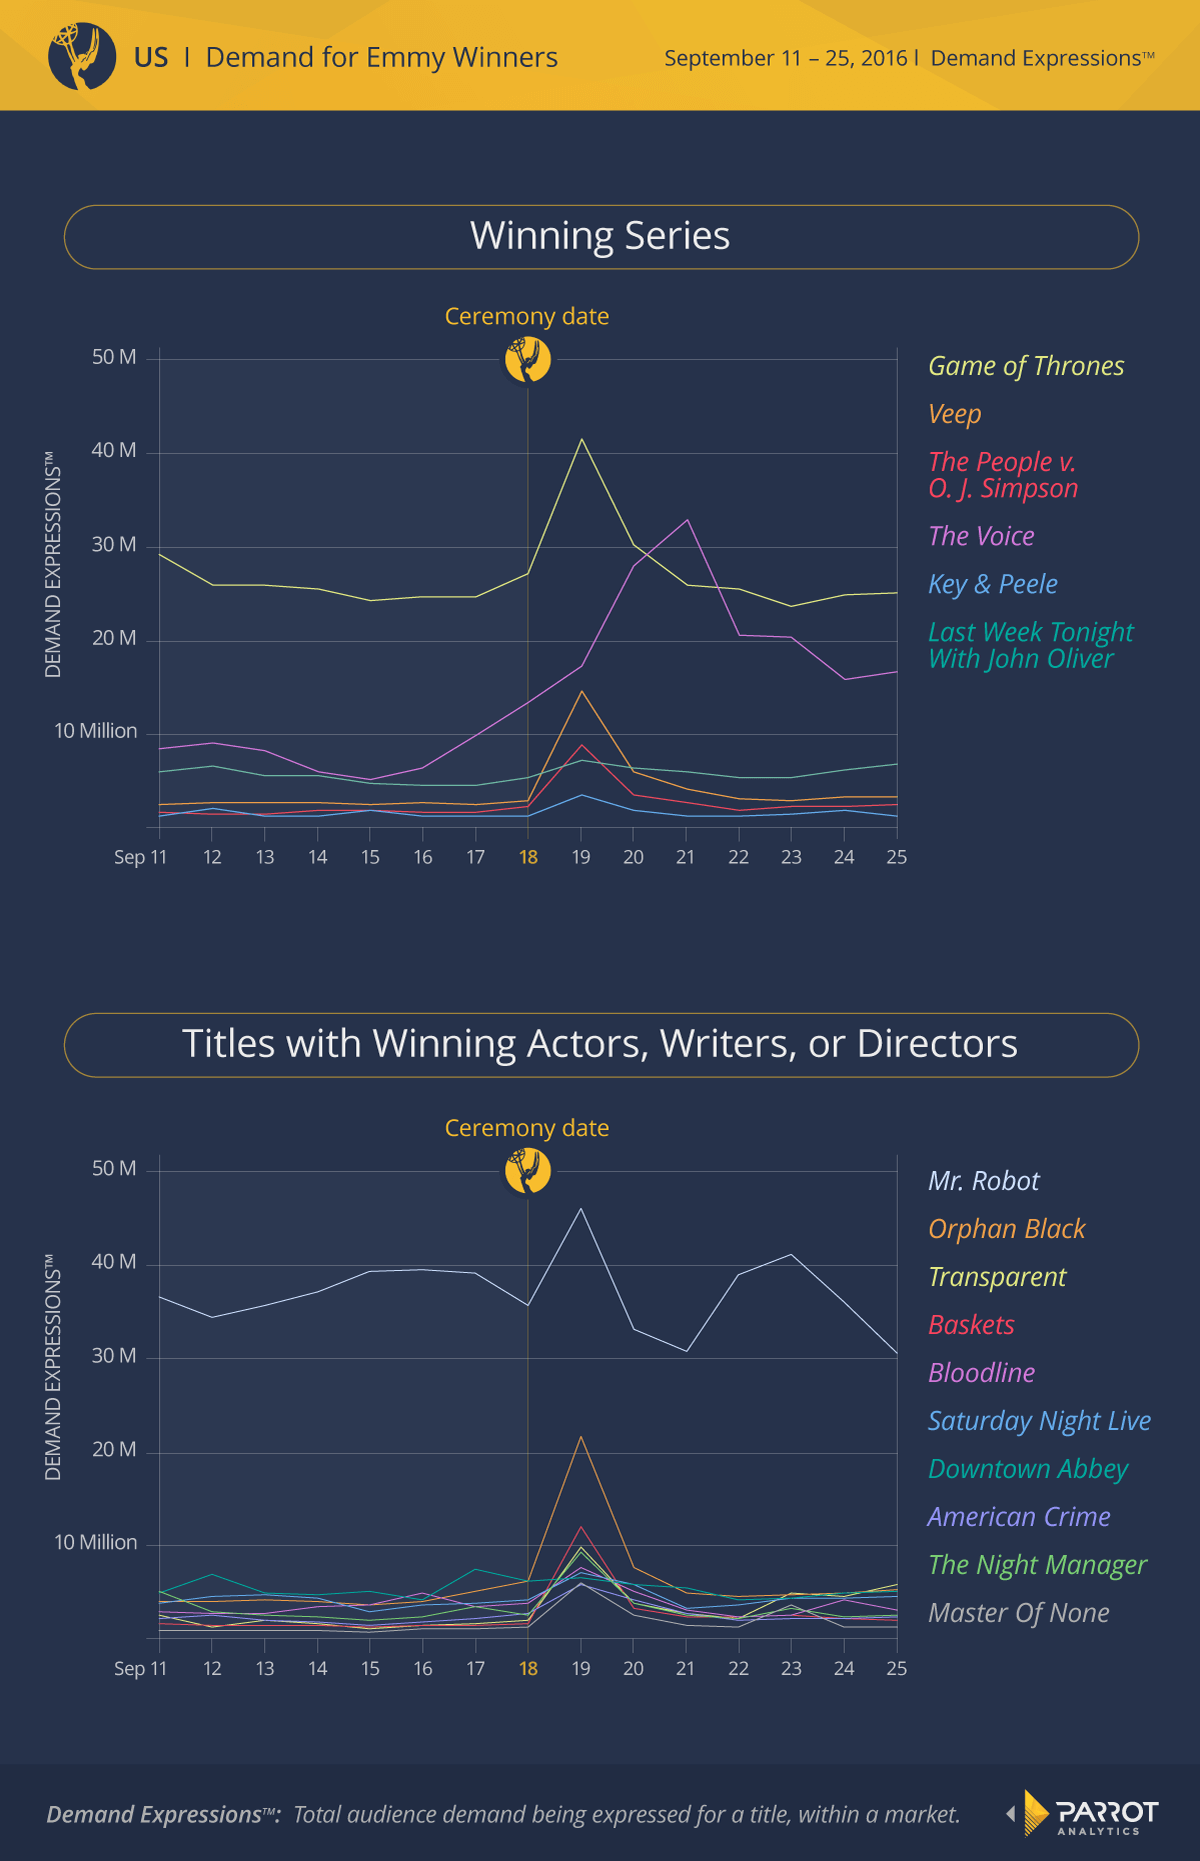
Clearly, demand spiked for nearly every winning series on the day after the Emmys, September 19th. Only Last Week Tonight with John Oliver and Downton Abbey did not have visible increases, but all other series, even the mega-popular Game of Thrones and Mr. Robot, had a significant peak in their popularity. Demand for The Voice continued to grow after the Emmys because its 11th season also premiered on the 19th. On the other hand, Rami Malek’s win for Outstanding Lead Actor in a Drama garnered 12% more demand than the season finale of his show, Mr. Robot.
Winning an Emmy, whether for the show itself or for acting, writing, or directing, boosts the demand of any type of title, but are some boosted more than others? The percent change between the average demand for the series before the Emmys (September 1st-18th) and the demand on September 19th is calculated for each winning title. Note that a title that won multiple categories, such as Veep for Outstanding Comedy Series and Outstand Lead Actress in a Comedy, is only listed once.
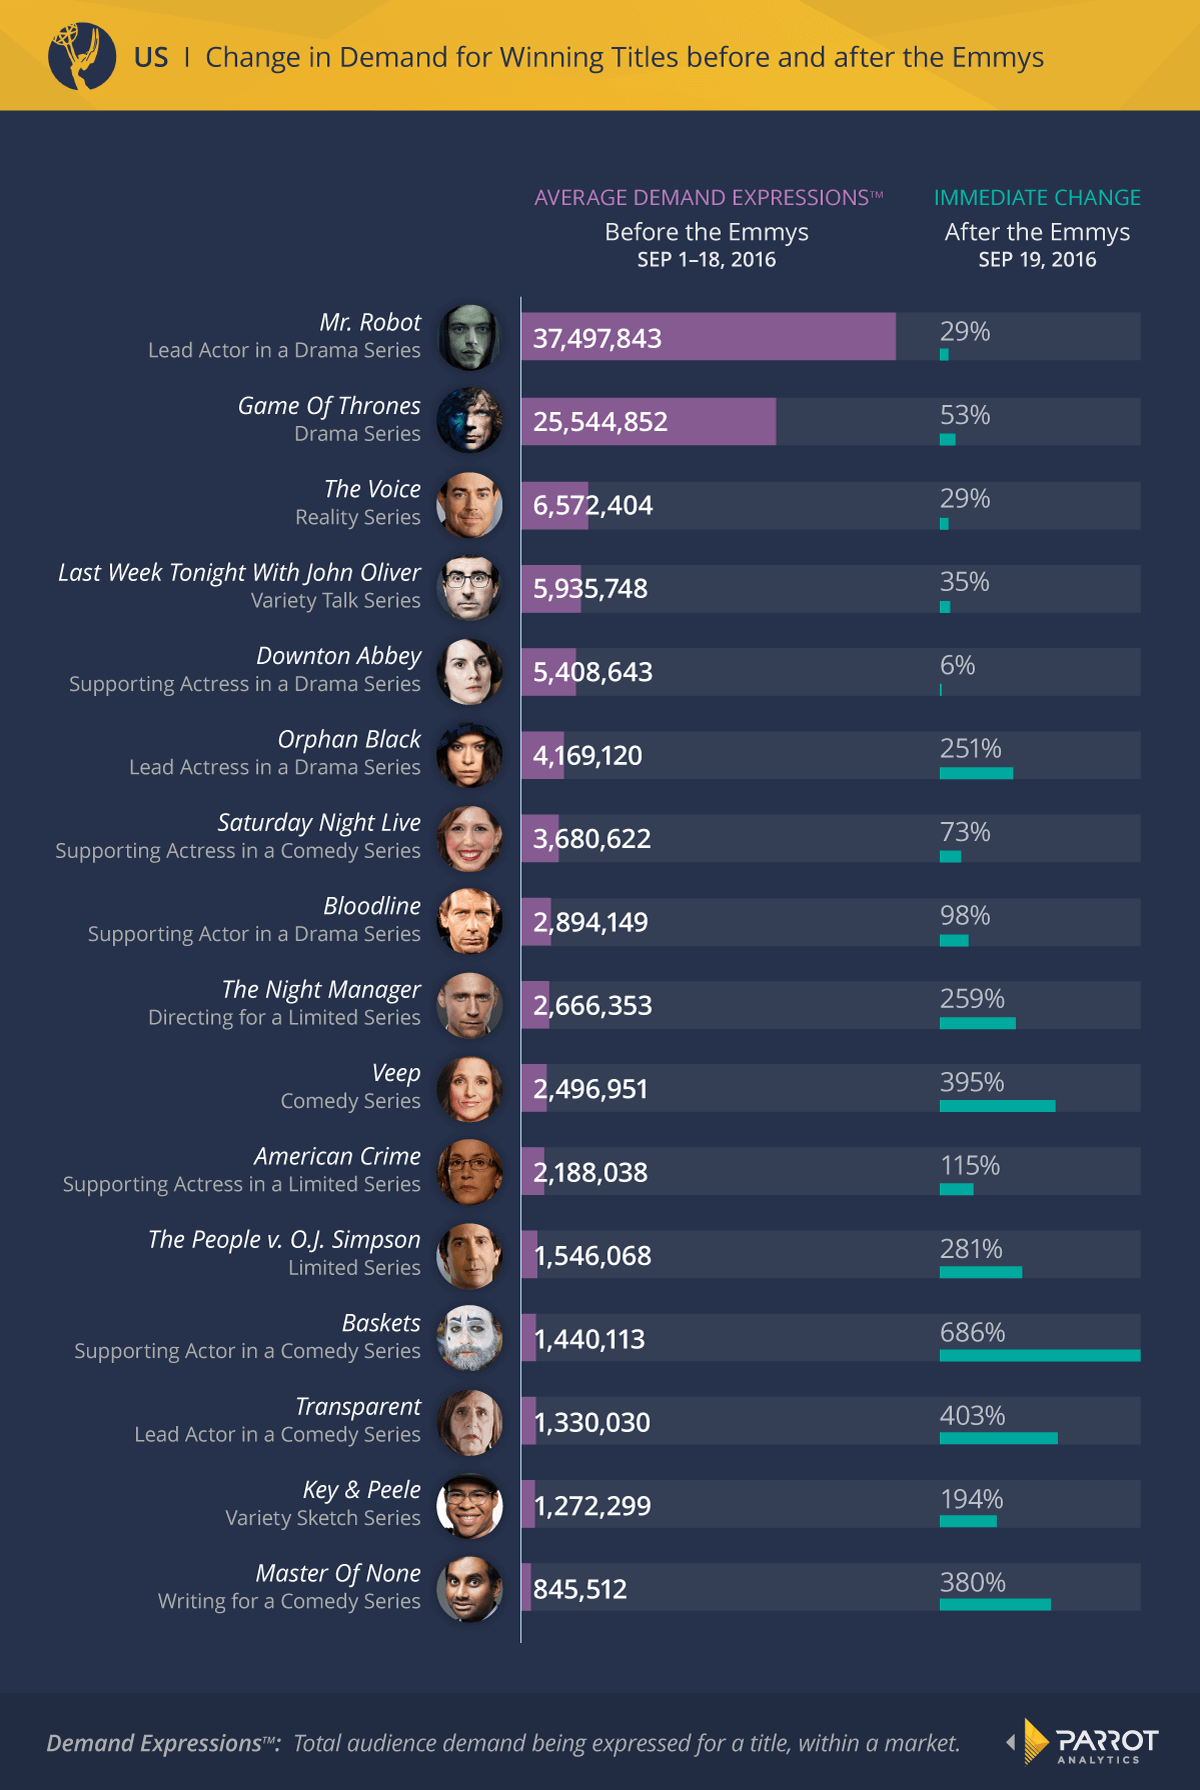
As seen in the plots of demand over time, Downton Abbey was least affected by its win for Outstanding Supporting Actress in a Drama (which Maggie Smith was not even present to collect) while the rest of the winning series had an average demand increase of nearly 220%. The show with the most significant increase was Baskets, an obscure title on FX which nevertheless earned Louie Anderson the award for Outstanding Supporting Actor in a Comedy. This previous obscurity likely led to the largest increase in demand for Baskets as people, upon hearing about the show for the first time, began researching it online, seeing what their friends thought about it on social media, and perhaps started downloading it to watch for themselves. In contrast, shows like Downton Abbey are already familiar to many viewers and so its win did not inspire the same actions: if someone had already chosen not seen the show, yet another Emmy win for it was not going to change their minds.
To determine if this trend holds for the rest of the winning series, both their average demand and percent change in demand are ranked. The correlation between these two rankings is found to quantify the relationship between a title’s popularity and impact of winning on its demand. On a scale of -1 to 1, the correlation coefficient is -0.806, which means the two values are strongly anti-correlated. As we saw with Baskets and Downton Abbey, the more popular a series is, the less of an increase in demand it will experience after a win. All the series with over 5 million Demand Expressions™ had only a double-digit percent increase, while all those with less than 2 million Demand Expressions™ increased by over 100% after their win.
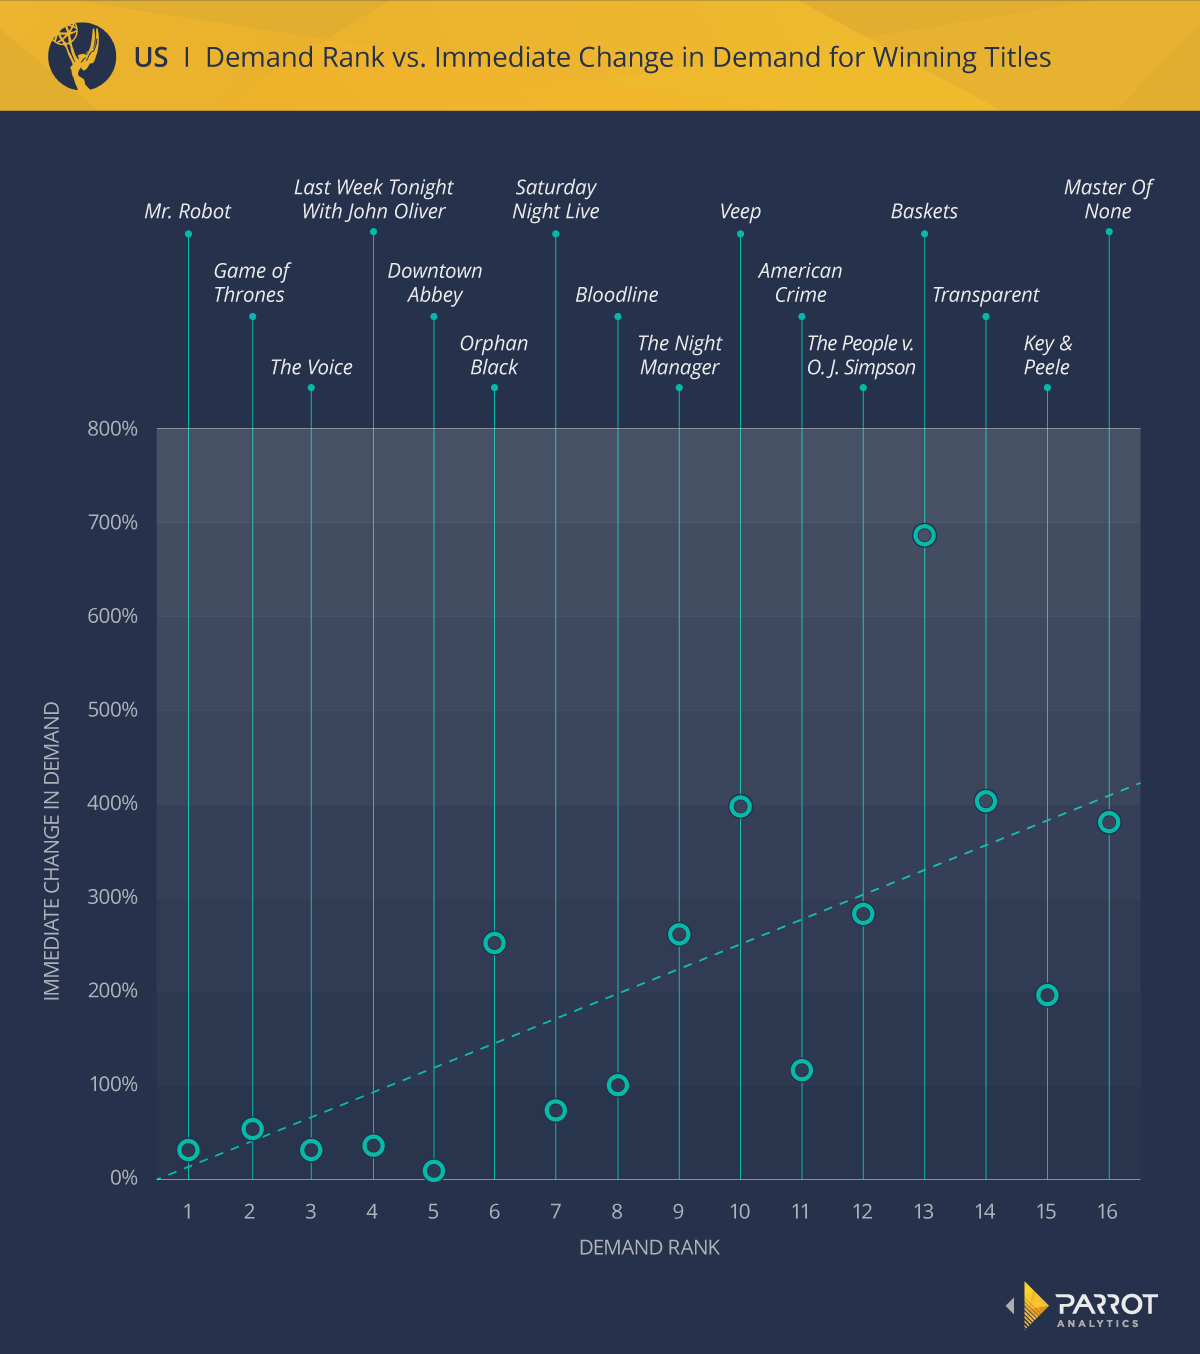
Overall, the least-popular series benefit the most from their Emmy awards.
This year’s Emmy winners had several interesting relationships with demand. When we first ranked the nominees by popularity during their latest season, we expected that lower-profile but critically acclaimed series would win in at least several categories. However, four out of the six winning series were the most in-demand in their category. The awards may have been a popularity contest for the Outstanding Series winners, but the more in-demand the title, the less affected it was by a win. The shows with the greatest increases in demand, both short- and long-term, were those that had the least demand going in to the ceremony.


