The media market has increasingly invested in a franchise model of business. While the serialized nature of TV has long inspired the creation of spinoffs, the extraordinary popularity of cinematic universes in movies has only served to further encourage this type of production for the small screen as well.
In the 90s, the TV market began to venture off into expanding series universes. Back then, producers tried out different strategies, which led to inconsistent results, such as spinoffs for outstandingly popular shows like Friends not lasting for even a full season. At the same time, some spinoffs turned out to be many times more successful than their original shows, like Xena: The Warrior Princess and Hercules: The Legendary Journeys.
With the first spinoff series to HBO’s Game of Thrones scheduled to come out this year, we thought we’d take the time to evaluate the performance of different TV spinoffs, gauging how they fare when compared to their respective original shows to understand the range of success these shows have recently achieved. In this article, we will also explore which shows have the most Franchisability potential.
Spinoffs that have carried the mantle
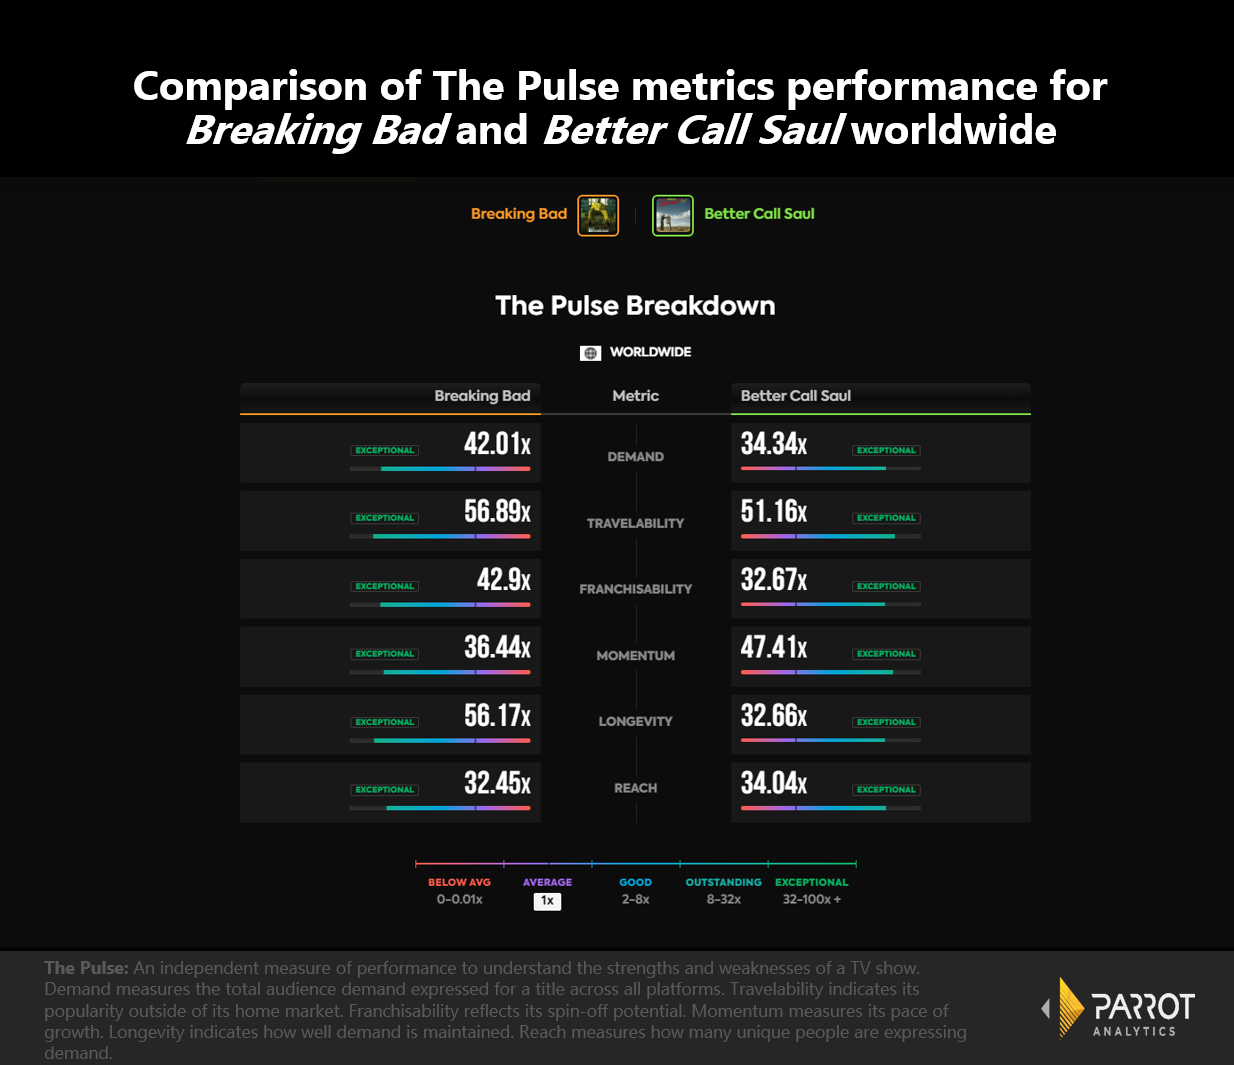
AMC’s Breaking Bad currently has 42.9x more franchisability than the average show and its spinoff show, Better Call Saul, has been successful. Although it hasn’t had the outstanding impact the original had, its performance is solid, as we can see in the following Pulse chart.

While the original show records 42x the demand average, Better Call Saul recorded 34.3x. Both shows also had exceptional Travelability, with Breaking Bad earning 56.8x the average in the index, and the spinoff series earning 51.1x.
Better Call Saul even overtakes Breaking Bad in two metrics. It was a couple of points ahead in the Reach metric, registering 34x the demand average while Breaking Bad had 32.4x. Additionally, the spinoff exceeded the Momentum metric, garnering 47.4x the demand average, compared to Breaking Bad’s 36.4x.
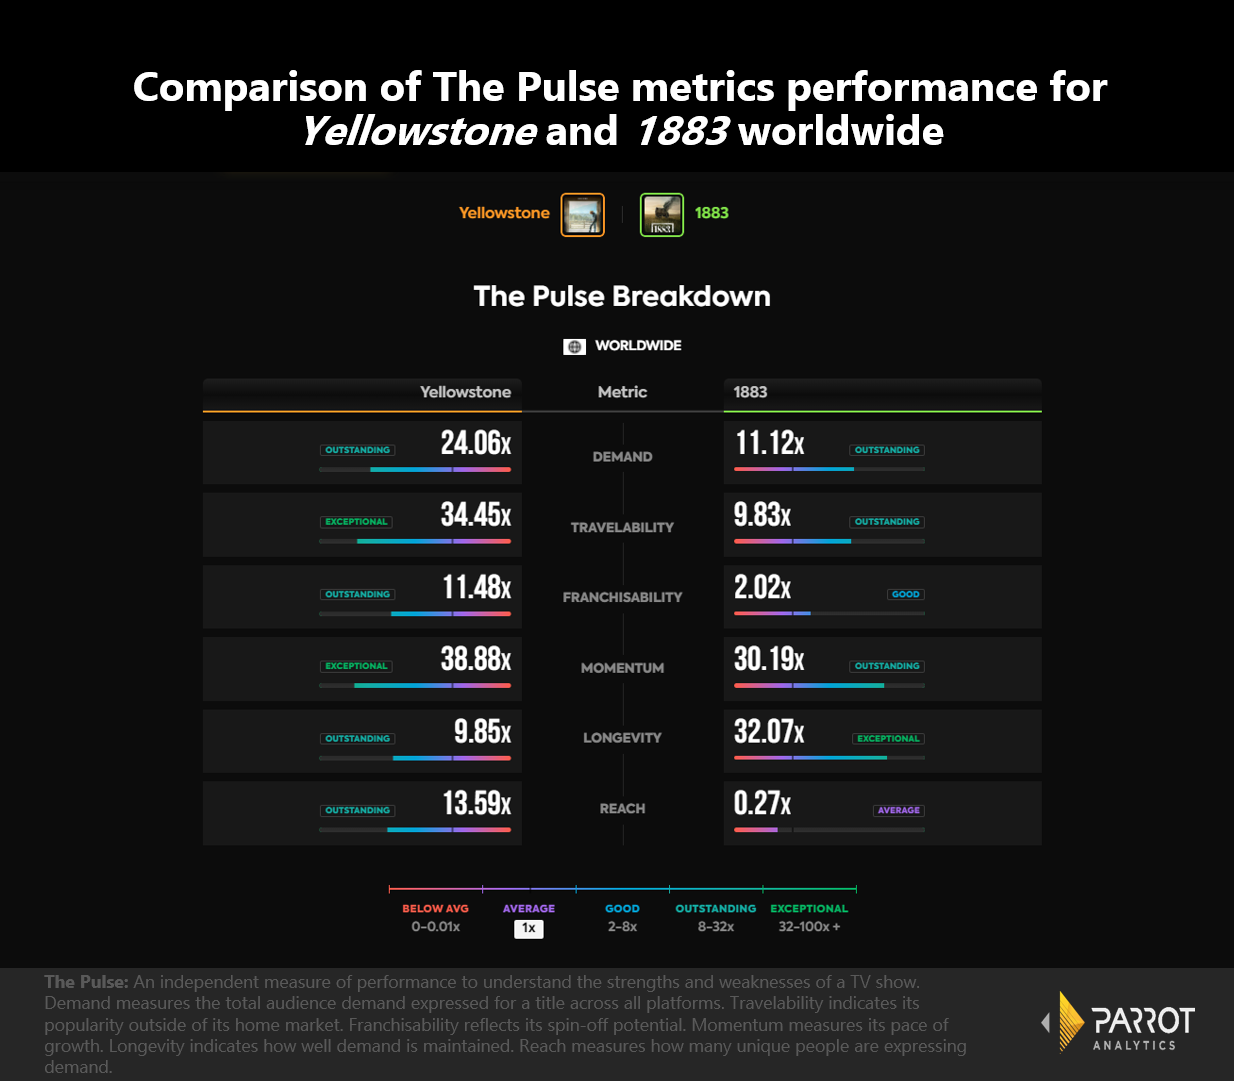
Similarly, Paramount+’s 1883 has also closely followed the performance of the series it was derived from, Yellowstone. Released in 2018, the original series demonstrated spinoff potential, recording 11.4x in Franchisability. Looking at the chart, we see that Yellowstone exceeds in most Pulse metrics when compared to 1883, but not all.

In Demand, Yellowstone records 24x the average, compared to 1883’s 11.1x. In Travelability, the original show boasts a rate of 34.4x the demand average, while the spinoff has 9.8x. Meanwhile, 1883 had the best performance was in Longevity, with only a single released season. It earned 32x the demand average in this metric, dwarfing Yellowstone’s 9.8x.
Shortcoming spinoffs
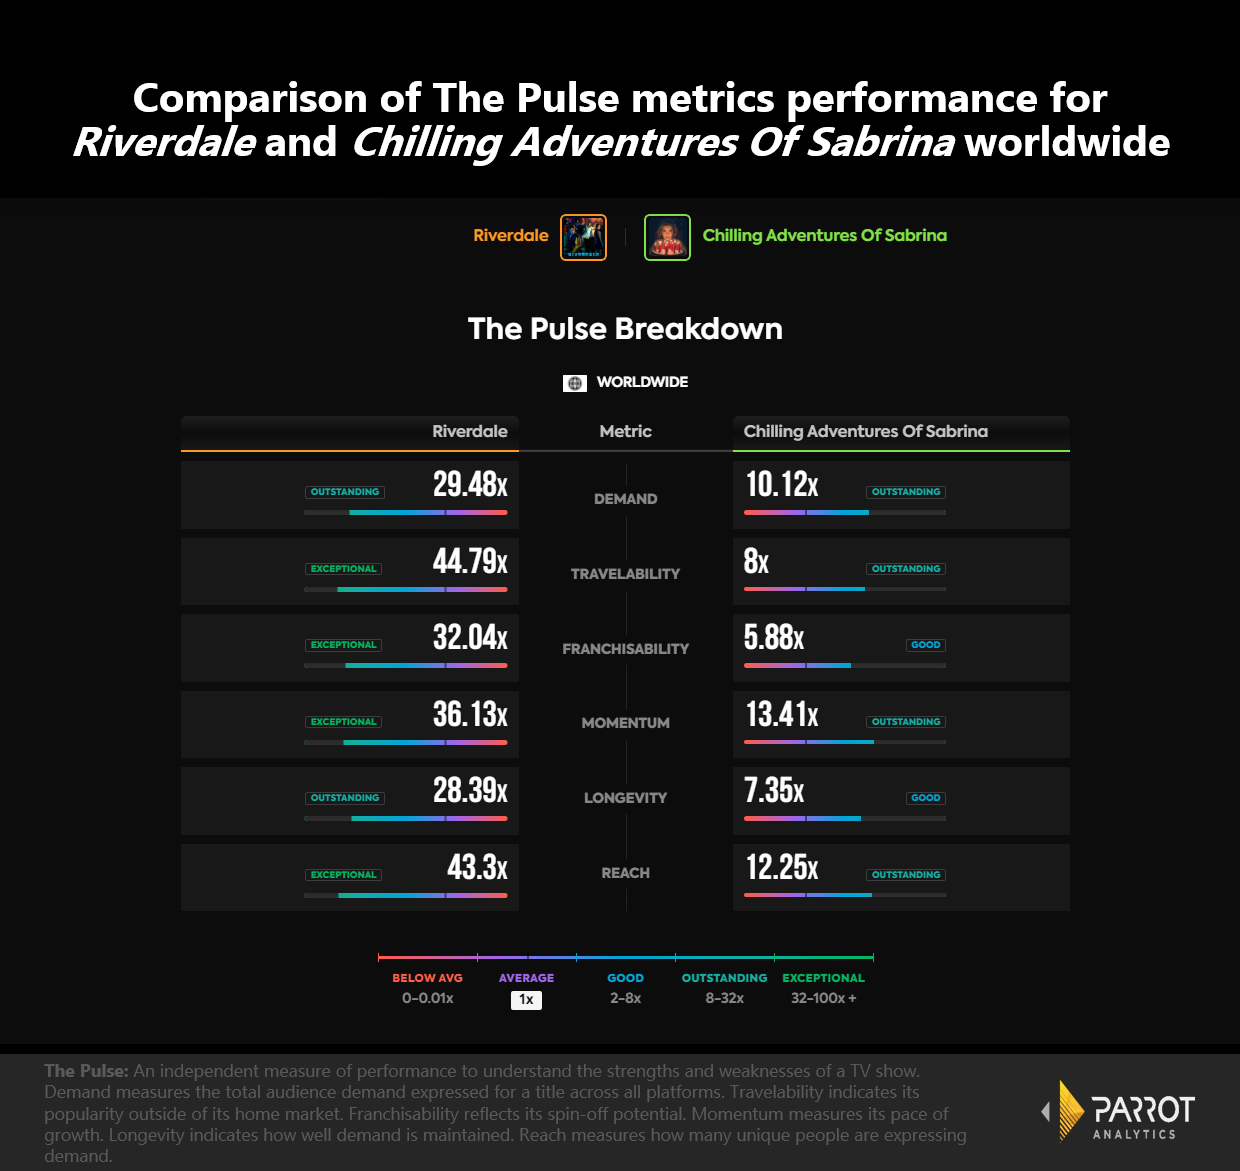
On the other hand, the performance of The CW Riverdale’s spinoff, The Chilling Adventures of Sabrina, seems to lag significantly behind the original show. Both shows were created by Robert Aguirre-Sacasa and there were plans for crossovers between them, but the spinoff was cancelled by Netflix on its fourth season. Furthermore, Riverdale demonstrates a lot of spinoff potential, recording 32x the Franchisability average.

Comparing the Pulse metrics for each show we see that, in Travelability, Riverdale records 44.7x more than the average show, while The Chilling Adventures of Sabrina had just 8x. Similarly, Riverdale earned 27.3x in Longevity, while the spinoff had 7.1x. Finally, while Riverdale earned 43x than the average in the Reach metric, The Chilling Adventures of Sabrina earned 12x the average show.


