Netflix’s most popular original series, Orange is the New Black, recently released its latest season, causing a huge increase in demand for this title. As revealed last week in our Game of Thrones feature, Orange is the New Black is one of the most in-demand series after its season releases, ranking behind only the two cable megahits, Game of Thrones and The Walking Dead. Though Netflix does not release viewership data, it has stated, from the first season, that Orange is the New Black has been its most-watched original. In fact, a recent Netflix study revealed that over half of viewers re-watch the show, especially in the lead-up to the latest season release. These numbers put Orange is the New Black among the most elite TV shows and thus deserving of an in-depth analysis in the wake of its season four release.
To reveal the evolving demand for Orange is the New Black, the Demand Expressions™ in the United States are plotted from May 1st, 2015 to June 19th, 2016, encompassing both season three and four. As each season of Netflix’s series are released on a single day, the pattern of demand is dramatically different from the demand for a traditional, one episode a week series such as Game of Thrones.
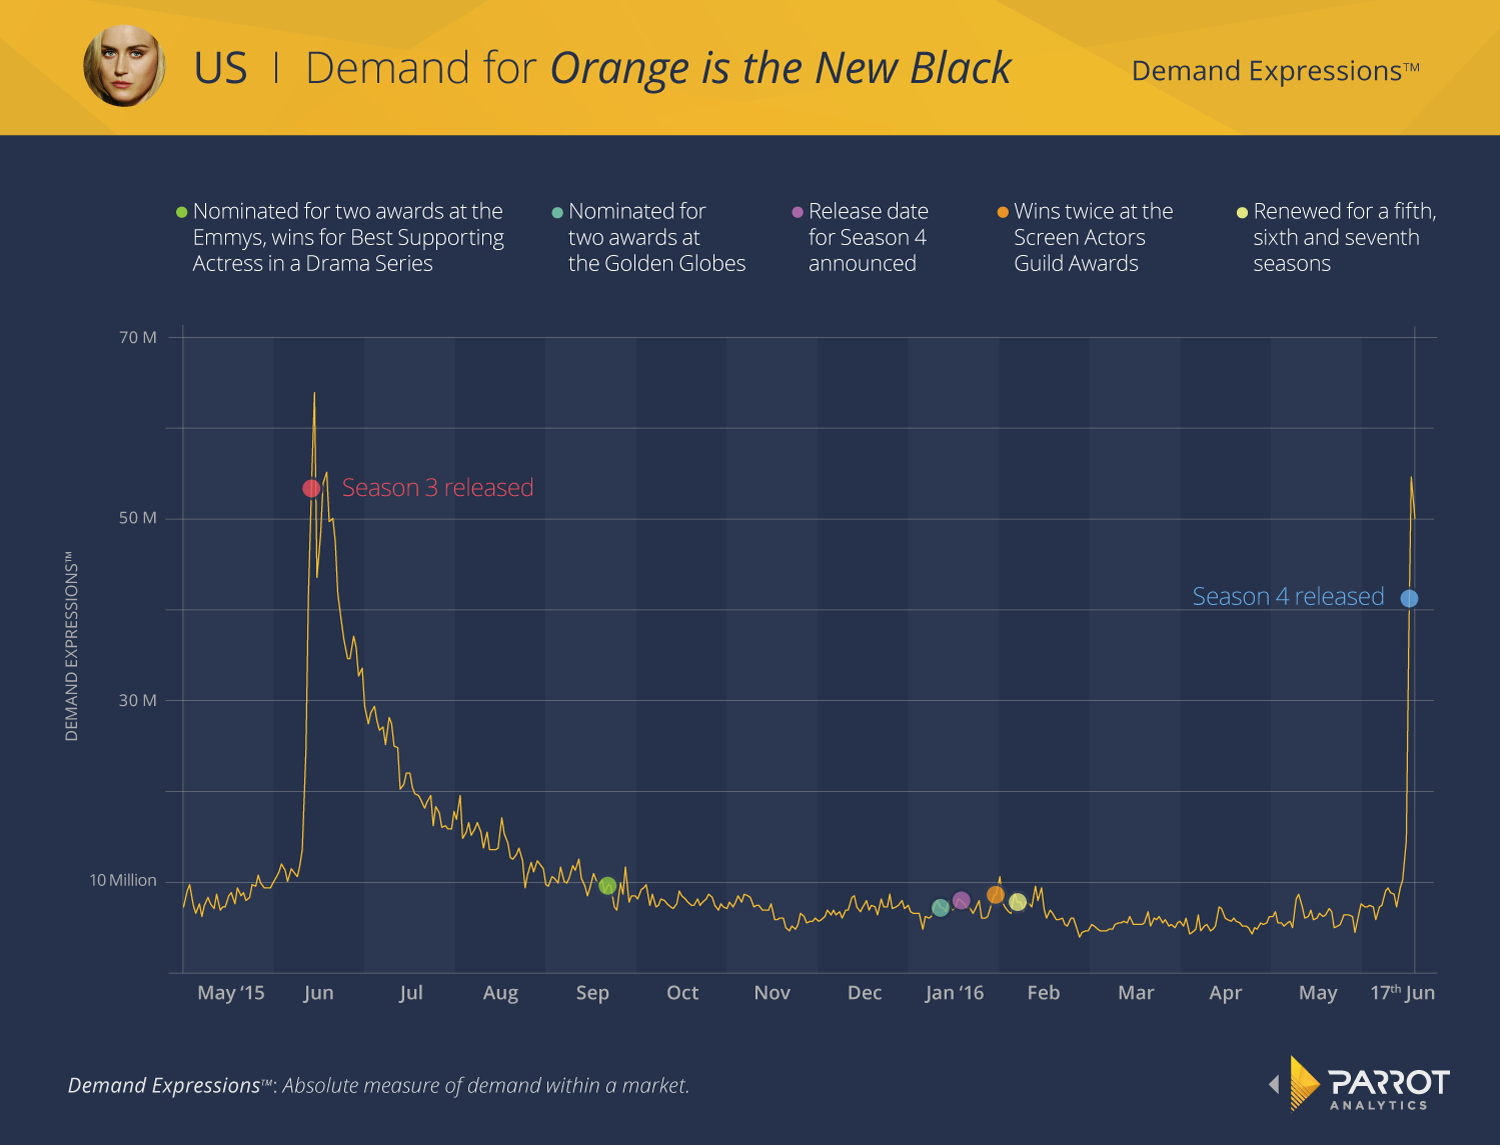
In the days after a season is released, demand for Orange is the New Black increases massively: season three saw a 455% increase from the average demand during the week before release, and season four had a very similar 454% increase. In contrast, the increase in demand for Game of Thrones’ season 6 release was only 118%. With 13 episodes immediately available instead of one, the demand increase is correspondingly greater as begin to watch and discuss the entire season at once.
Orange is the New Black’s third season was released on Thursday June 11th 2015, with the maximum demand occurring on June 14th, the Sunday after release. Likewise, demand for the fourth season seems to have peaked on June 18th, 2016, the Saturday after release. Naturally, the most binge-watching and discussion appears to occur on the weekend following a season release as viewers can set aside enough time to get through the episodes.
In addition, after the third season of Orange is the New Black a resurgence in demand occurs a week after release, on Friday, June 17th and Saturday, June 18th. One hypothesis for this bump is that the people who did not finish the season in the first weekend complete it during the second weekend. Another possible reason is related to Netflix’s recent study on binge-watching, which found that “when members are focused on finishing a series, they watch a little over two hours a day to complete a season.” With 13 hour-long episodes, it would take these average viewers about a week to complete the season, corresponding to the one-week bump in demand as these viewers finish the season and begin discussing it with others.
Whatever the reason for this surge in demand, it is not maintained over time. Whereas demand for a show like Game of Thrones remains high between episodes, shows like Orange is the New Black experience the boost in demand for the season premiere and drop-off in demand after the season finale nearly simultaneously. The decrease in demand for Orange is the New Black follows a fairly smooth curve, levelling out at about 7 million Demand Expressions™ in November 2015, the same timeframe as Game of Thrones. However, unlike Game of Thrones, demand for Orange is the New Black is not affected much by external events such as awards or news on the upcoming season. The largest increase in demand is the 22% rise after Orange is the New Black wins for Outstanding Performance by a Female Actor in a Comedy Series (for Uzo Aduba) and Outstanding Performance by an Ensemble in a Comedy Series at the 22nd Screen Actors Guild Awards in late January 2016. Clearly Orange is the New Black is not as “buzzy” as Game of Thrones, where every bit of news or marketing sparked a brief frenzy of demand.
Though the fourth season was released only a few days ago, demand for the third and fourth season can be compared by day.
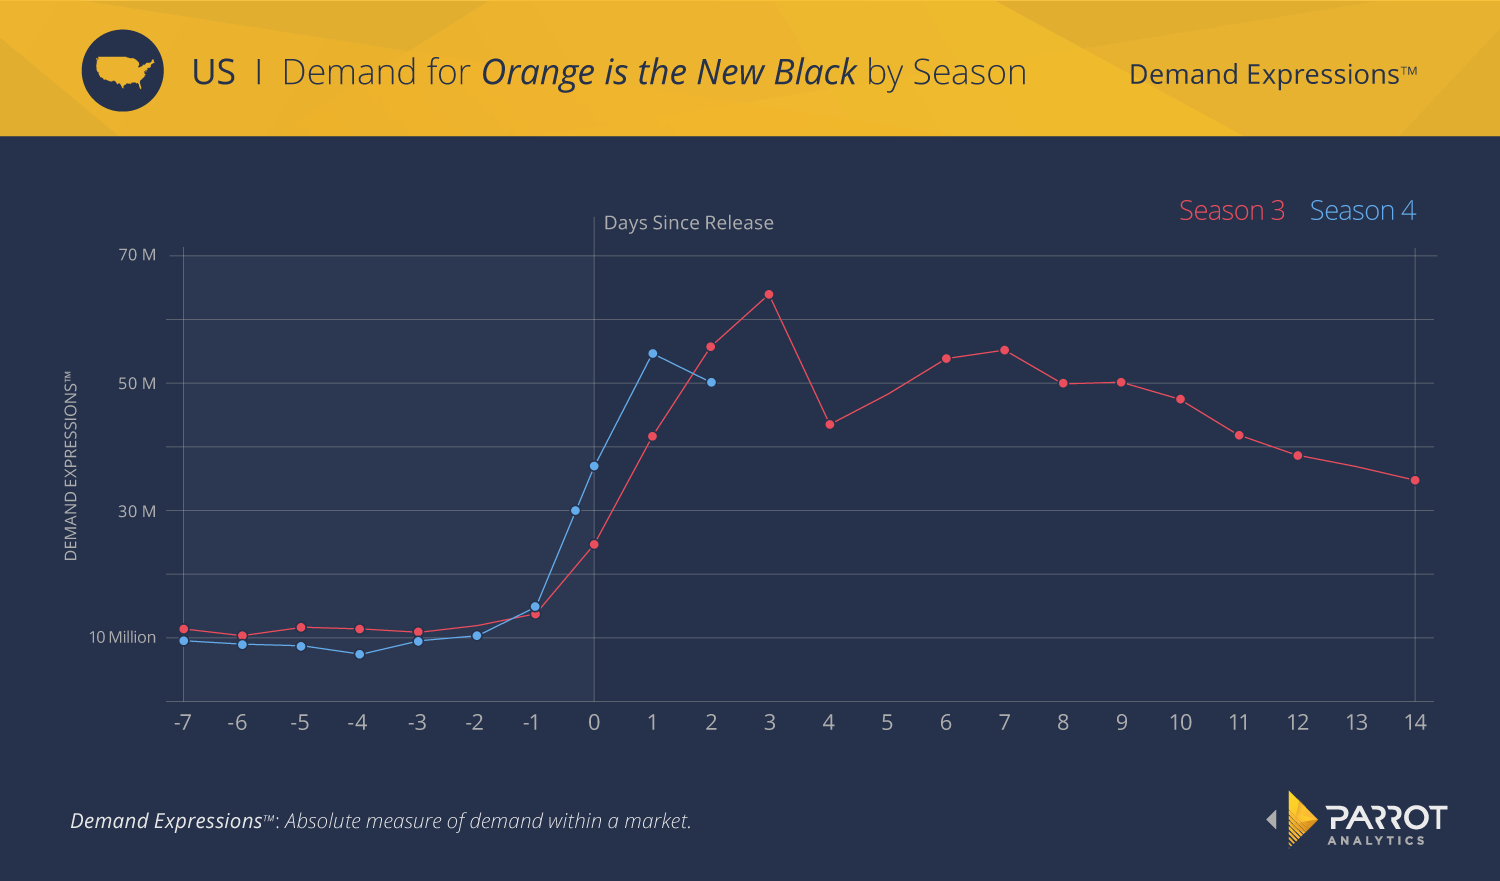
While season four had 50% more demand than season three on the day of release, demand for season four appears to have peaked already at 54 million Demand Expressions™, 15% lower than season three’s peak of 64 million Demand Expressions™. We expect to see a slight increase in demand a week after release, but judging by the patterns for season three, this bump in demand will not exceed the initial maximum immediately after release. With less overall demand for Orange is the New Black’s fourth season, it will be interesting in the coming months to see if demand falls off faster than it did for season three.
Fortunately for Orange is the New Black, it enjoys high international demand. Out of over 100 markets, the United States ranks 26th in terms of average Demand Rating™ from May 2015 – June 2016 for the title, suggesting that though demand for season four may be disappointing in the US, it is strong elsewhere.
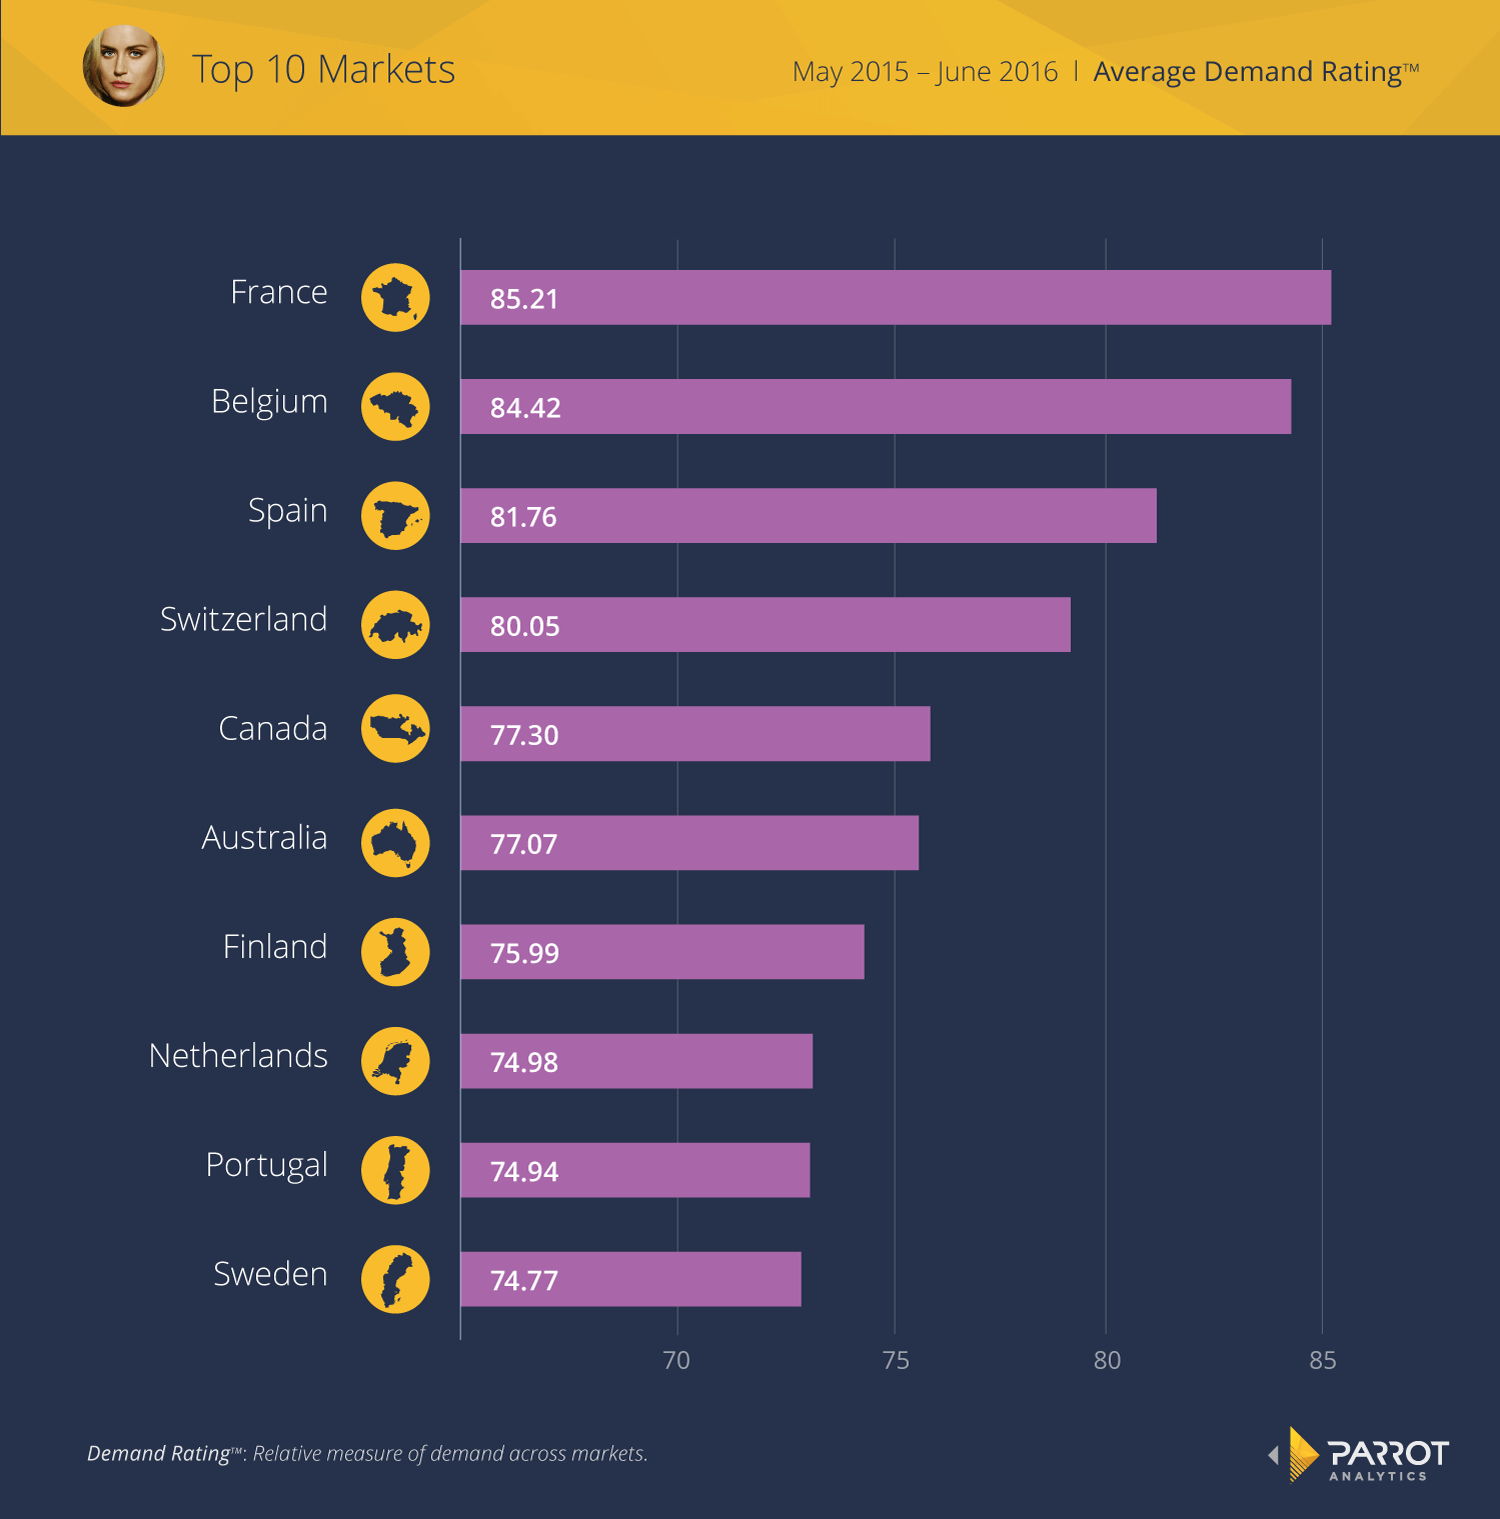
With the exception of Canada and Australia, most of the top ten markets for Orange is the New Black are in Europe. Due to the exponential nature of Demand Rating™, demand in France, where Orange is the New Black is most popular, is over twice as much as in the 10th ranked market, Sweden and over 2.8 times greater than in the United States. One reason for this popularity may be availability: Netflix has been present in all the top ten markets since 2015 so Orange is the New Black has been easily watchable and undoubtedly promoted in these markets for a few years, growing its international fanbase.
Such a detailed analysis, especially of a digital original series where no viewership data is available, can only be conducted using the universal measures of Demand Expressions™ and Demand Rating™. Because these measures apply to any type of content, series such as Game of Thrones and Orange is the New Black can be directly compared, revealing significantly different trends in demand. These trends indicate that different strategies for distribution, marketing, etc. should be pursued for these different types of content.

