The year 2016 was good to SVOD platforms. Netflix released several new hits, notably science fiction drama Stranger Things, Hulu found critical success with miniseries 11.22.63 and The Path, and both Netflix and Amazon Video launched in over 200 new markets. While the exact number of viewers on each platform remains secret, demand can be used to qualitatively assess the success of these platforms. The popularity for each service’s original series, as measured by demand, are tracked over the past year, and in Netflix’s case, compared to the measure of public performance: stock price.
The Demand Expressions™ for each original on the platform were summed by week and plotted below. Since this plot displays the total popularity of the original series on each platform, the trends are affected by both the demand for each title and the number of originals on the platform.
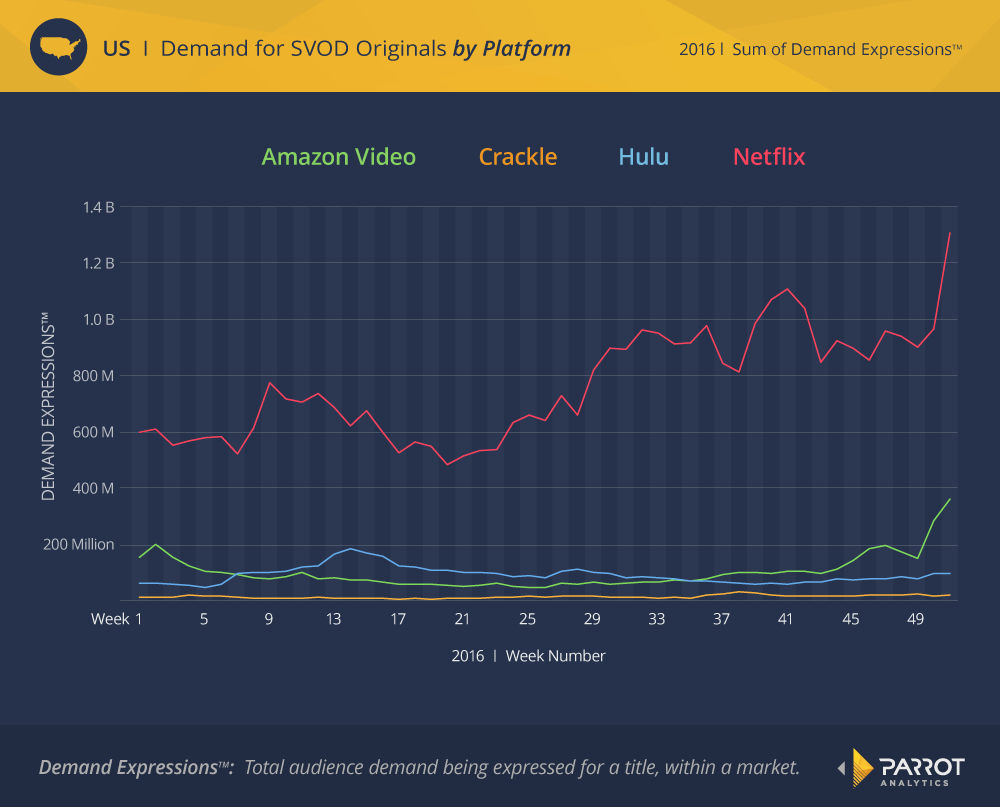
With over 50 original titles, it should be no surprise that Netflix has the greatest total demand. The popularity of its content is, on average, over 8 times more than Amazon Video, over 9 times more than Hulu, and nearly 60 times more than Crackle, which has only seven original titles. Netflix’s veteran titles still attract significant amounts of demand, such as the peak in March (weeks 9-13) from the fourth season of House of Cards and the second season of Marvel’s Daredevil. However, Netflix’s true strength is in its constant production and release of new, buzzy content: after the premiere of Stranger Things in week 28, demand increased to new heights. Other new hits such as Marvel’s Luke Cage in week 39 and The OA in week 50 continued to build on this popularity, leading Netflix to end the year with over 2.7 times more demand than the other three platforms combined.
The demand for a platform’s original titles may be connected to other key metrics of SVOD success. The stock price for Netflix is plotted against the total demand for its originals over 2016 (excluding weekends):
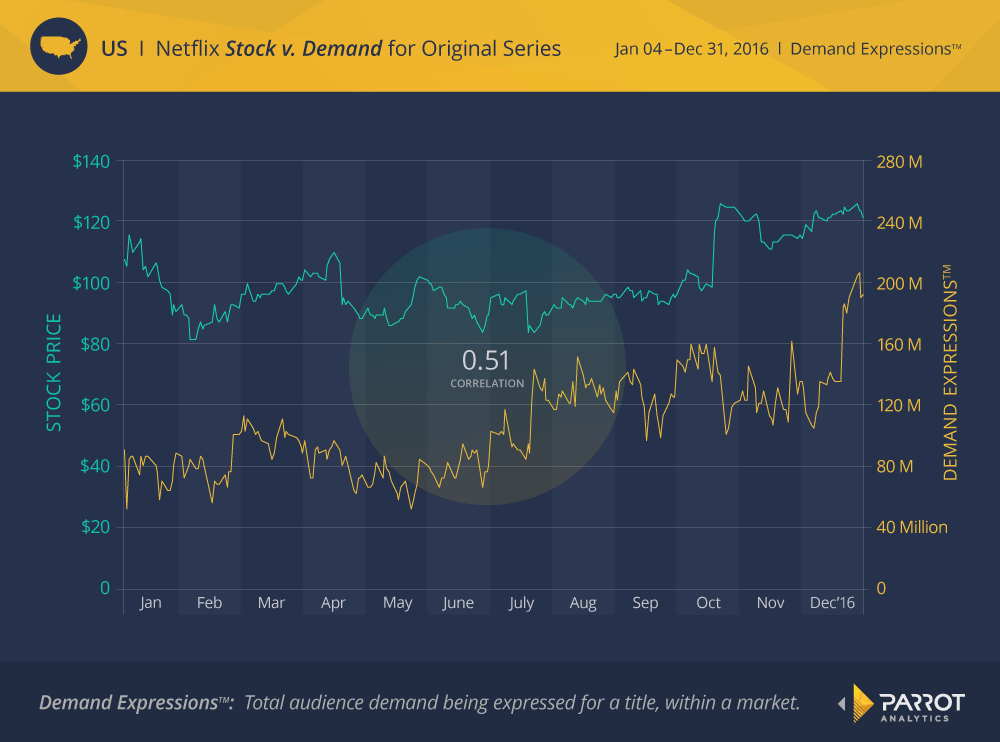
These two metrics have a significant 0.51 correlation. While correlation does not necessarily mean that these metrics are connected, statements by Netflix during their fourth quarter earnings report support the hypothesis that they are.
In the report released on January 18th, Netflix revealed that their global streaming revenue had year-to-year growth of 41% last quarter, driven by their acquisition of over 7 million new subscribers which exceeded expectations. As a result of this good news, Forbes reports that Netflix shares were traded at up to 8.4% after hours. Netflix attributed these results to its strong catalogue, noting that gaining subscribers is based on a “cumulative effect:” Reed Hastings said that “very few people will join Netflix just because of a single title, but there is a tipping point. You have one more title that has great excitement, that you are hearing a lot about, and that triggers you to finally sign up for Netflix.”
Therefore, the total measured demand for Netflix originals (which consumers can get nowhere else) contributes to more subscribers joining the platform, which increases streaming revenue, which leads to growth in Netflix’s stock price.
The other major US SVOD platforms have a long way to go to catch up to Netflix in terms of number of original series and the total demand for this content. Netflix’s popular content attracts new subscribers, both in the US and internationally, which contributes to growth in its stock price. While none of the other platforms are standalone public companies, Netflix demonstrates how important in-demand content is to the success of an SVOD service.

