At Parrot Analytics we love all TV content, but the office favorite is undoubtedly Game of Thrones. We’re not the only people heavily invested in the power struggles of Westeros: the show attracts millions of viewers on HBO, tops yearly lists of most-pirated TV shows, and has many times more Demand Expressions™ than any other show when it is airing. To celebrate this unprecedented popularity, we take a closer look at the demand for Game of Thrones over the past two seasons and compare it to other mega-hit TV series.
To get a full overview of the demand over time for Game of Thrones, the Demand Expressions™ in the United States are plotted from just before the release of season 5 until today (April 1st, 2015 – June 6th, 2016). The fifth and sixth seasons are clearly distinguished by high demand for each episode, but demand also noticeably increases for news and events related to Game of Thrones in the off-season.
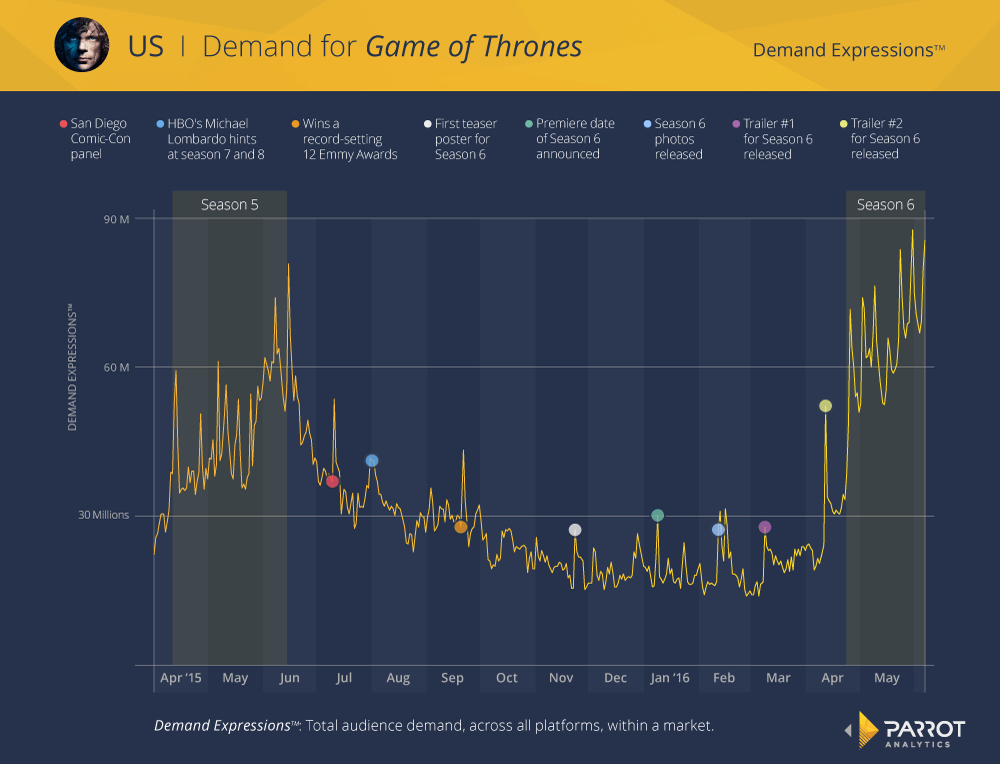
Looking closely at demand during seasons, there are spikes in demand correlating to each episode, but the increase occurs on the day after the episode airs. As the show airs at 9:00 p.m. in the US, most of the discussions (and catch-up viewing) happens on the next full day, leading to higher demand on this day. During both season 5 and 6, demand generally increases for each subsequent episode as excitement ramps up for the dramatic and often-shocking season finales.
After the season ends, demand for Game of Thrones (like most series) decrease. Its demand eventually stabilizing around 19 million Demand Expressions™ in November 2015. This general trend is punctuated by temporary increases in demand related to Game of Thrones news, however minor it may be. Even though the show’s panel at the San Diego Comic-Con revealed little about the upcoming season, demand still increased by 45% on the day after. HBO’s programming president made some comments about Game of Thrones extending to eight seasons on July 31st, 2015, which correlated to an increase in demand though those seasons were not confirmed. The greatest increase in demand was the 55% increase after Game of Thrones won a record-setting 12 Emmys. Clearly fans of the show are hungry for any news about their favorite show, especially when it is off the air.
With such large increases in demand related to minor Game of Thrones news, it is not surprising that the marketing campaign leading up to the release of season six resulted in significant demand increases. The first teaser poster, featuring a dead Jon Snow, was released in November 2015, causing a 75% increase in demand. As the campaign went on, the most popular events were the announcement of the premiere date on January 8th (30 million Demand Expressions™) and the release of photos from season six on February 11th (27.4 million Demand Expressions™).
However, the most impactful marketing events were the season trailers on March 8th and April 11th. Not only did the releases attract a significant amount of demand, this demand was sustained: the average Demand Expressions™ after the first trailer was 15% higher than the stable, off-season demand, and the demand after the second trailer was 72% higher. These marketing efforts clearly and permanently increased demand for Game of Thrones leading into the sixth season.
By plotting the demand for the day after each episode, the similarities and differences between the fifth and sixth season can be examined. As the seasons have similar trends, we used a linear model to predict the demand for the last three episodes of season six, denoted by the dashed line:
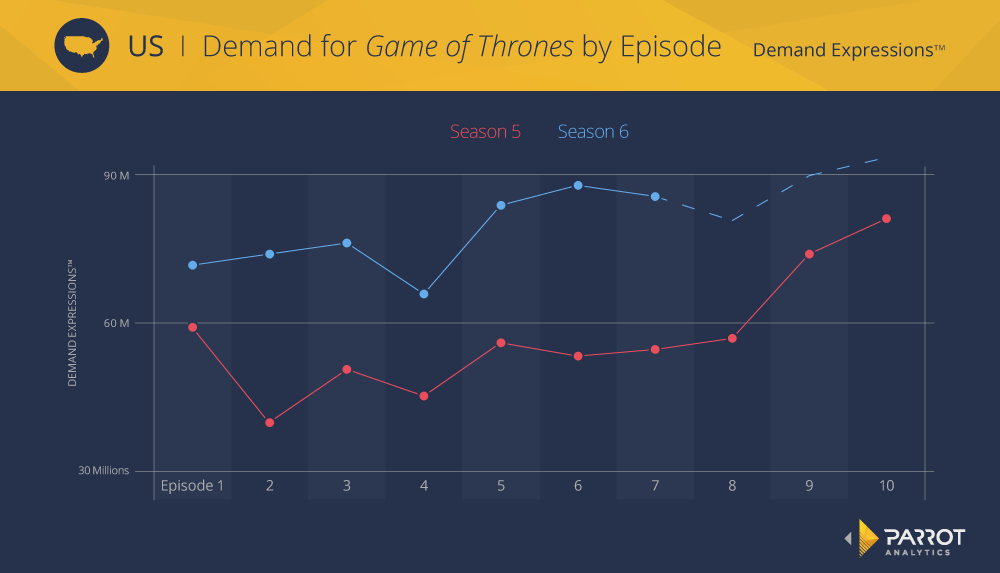
Every episode of season six so far has more demand than its counterpart in season five by an average of 53%. One hypothesis for this increase is that during this season, no one, including book readers, knows what is going to happen in the next episode, keeping interest high. In both seasons, demand is lowest early in the season, especially around episodes 2 and 4, then grows steadily to the finale. Similarly, our model predicts that demand for the next episode will be down slightly, then increase to have a finale with over 90 million Demand Expressions™.
All these numbers look impressive, but how does Game of Thrones compare to other extremely popular TV shows? The Walking Dead, as the most-viewed series on TV, also dominates demand in the US during its run, and Empire was a breakout hit last year. Out of the digital original series, Orange is the New Black is massively popular, though Fuller House may rival it as one of the most-watched shows on SVOD or linear TV, according to Symphony Advanced Media.
In order to compare these titles fairly, the demand during each show’s most recent season was averaged. The Walking Dead and Empire had split seasons so the demand was averaged over both segments, and for the Netflix shows, where the entire season was released on one day, the demand for the month following release was averaged.
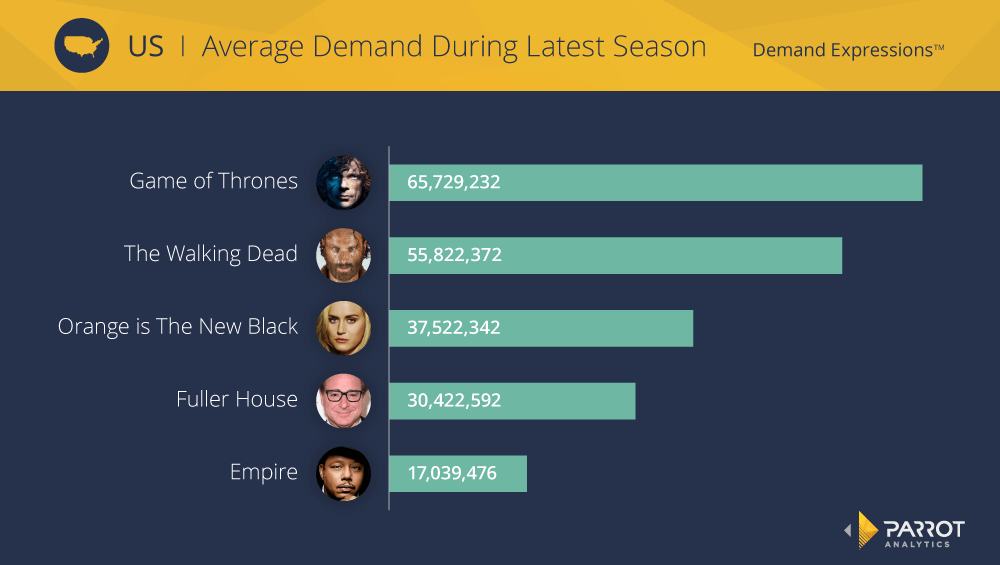
Out of these hit TV shows, Game of Thrones is the king: it currently has nearly 1.2 times the demand of The Walking Dead’s sixth season, 1.75 times more demand than Orange is the New Black’s third season, 2.2 times more demand than Fuller House, and more than 3.85 times more demand than Empire’s second season. If the demand increases for the final three episodes as predicted, then Game of Thrones’ lead over the other shows will only widen. Contrary to Symphony’s data, Fuller House (and most other shows on TV) still has quite a way to go in order to reach Game of Thrones’ level of popularity.
The high demand for Game of Thrones over the past year reveals some general trends. First, the sharp increase in demand on the day after an episode airs is found for many titles, not just Game of Thrones, and identifies when most of the interactions surrounding a TV show occurs. Second, the demand leading up to Game of Thrones season six reveals the impact of marketing: most major activities resulted in a spike in demand and the trailers even increased long-term demand for the show. Lastly, the dominance of Game of Thrones over other popular titles indicates the exponential nature of demand: if titles are ranked by demand, the top few shows have many times more demand than the vast majority of titles.
We focused on Game of Thrones in the US for this analysis, but using demand, this type of analysis can be conducted for any title, in any market. While not all shows have such high demand, an analysis of audience demand for any show can reveal similarly valuable information and trends surrounding how and when fans interact with it.

