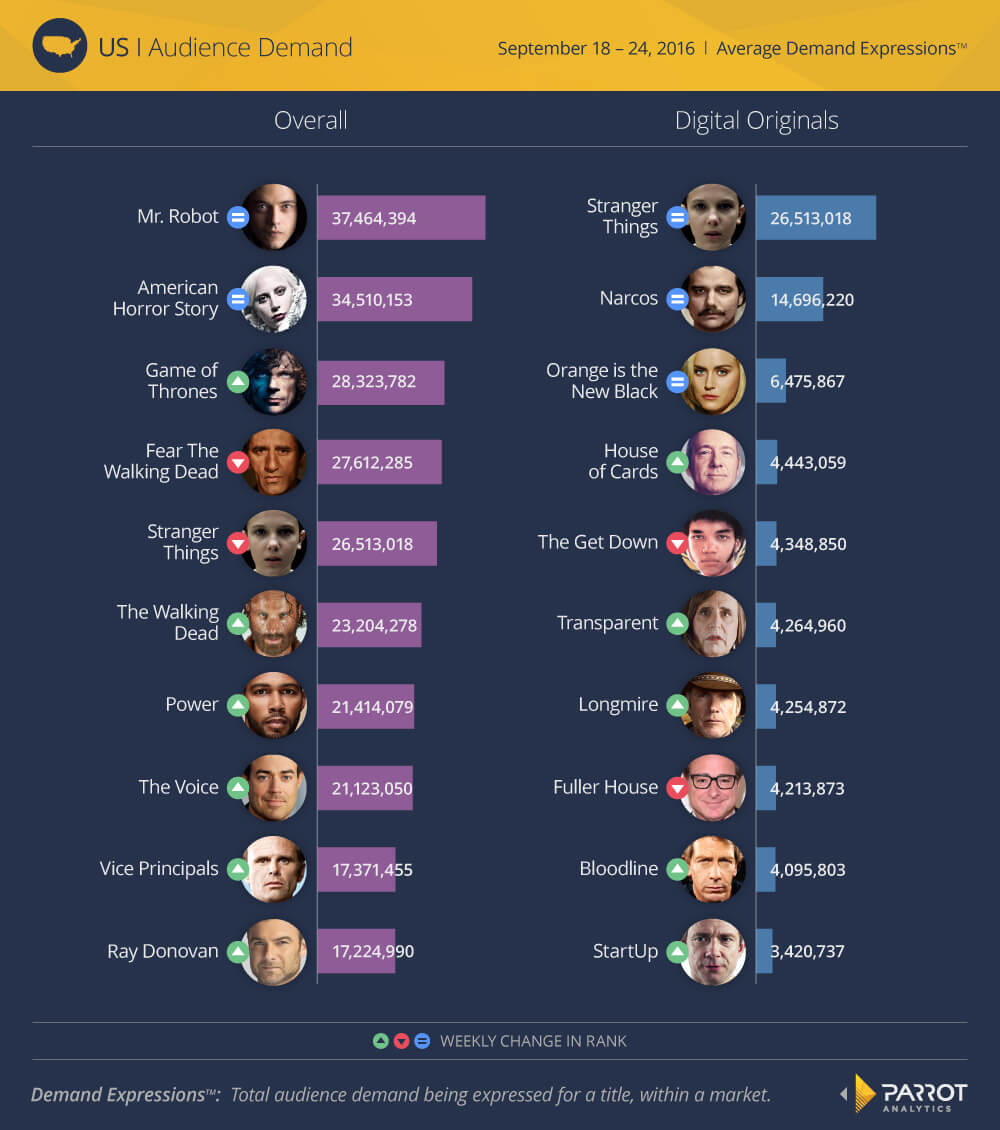
Parrot Analytics’ global TV demand data is generated in real-time. This enables the measurement of how much Netflix, Amazon and Hulu digital original series are wanted in 100+ markets around the world. We do this by applying Parrot Analytics’ globally standardized TV measurement metric, Demand Expressions.
The top shows, both overall and among the digital originals, remained the same this week. Demand for Stranger Things only declined by 3% this week while Narcos lost another 26%; Narcos still has over twice as much demand as the next-most popular series, Orange is the New Black. Following its season finale, Mr. Robot was still the most in-demand series in the United States with steady demand, while demand for American Horror Story dropped by 5%. In contrast, demand for Game of Thrones grew by 10% this week, making it rise to third place overall.
The top digital original series finally changed to include some new titles. Following its wins for Outstanding Directing and Outstanding Lead Actor in a Comedy Series at the Emmys on September 18th, Transparent rose to have only slightly less demand than The Get Down. The latest season of Longmire premiered on Netflix on September 23rd, causing its demand to rise significantly. Though Crackle’s StartUp was released earlier in September, it has only just gained enough demand to enter the top ten.
More season premieres and finales caused titles to rise into the top ten shows overall. In addition to Mr. Robot’s finale this week, both HBO’s Vice Principals and Showtime’s Ray Donovan concluded their latest seasons on September 18th. However, the season premiere of The Voice had 21% more demand than these finales.

