Image: Fuller House, Netflix
Parrot Analytics’ TV measurement standard is powered by Demand Expressions, enabling the industry to quantify which television series across all networks and platforms have the highest television demand for content. The inherently cross-platform nature of the metric means that audience demand for television content from across the industry – SVOD, OTT, linear and cable – can be captured around the world.
And as we do each week, let us now take a look at U.S. domestic demand numbers for streaming digital originals, as well as all TV series, across all platforms in the U.S during the holiday period. In the week building up to Christmas, we saw few changes to the digital series demand chart as most series are on hiatus. However, Netflix is releasing more than 30 new titles in January 2019, and we expect demand chart fluctuations as a result of this.
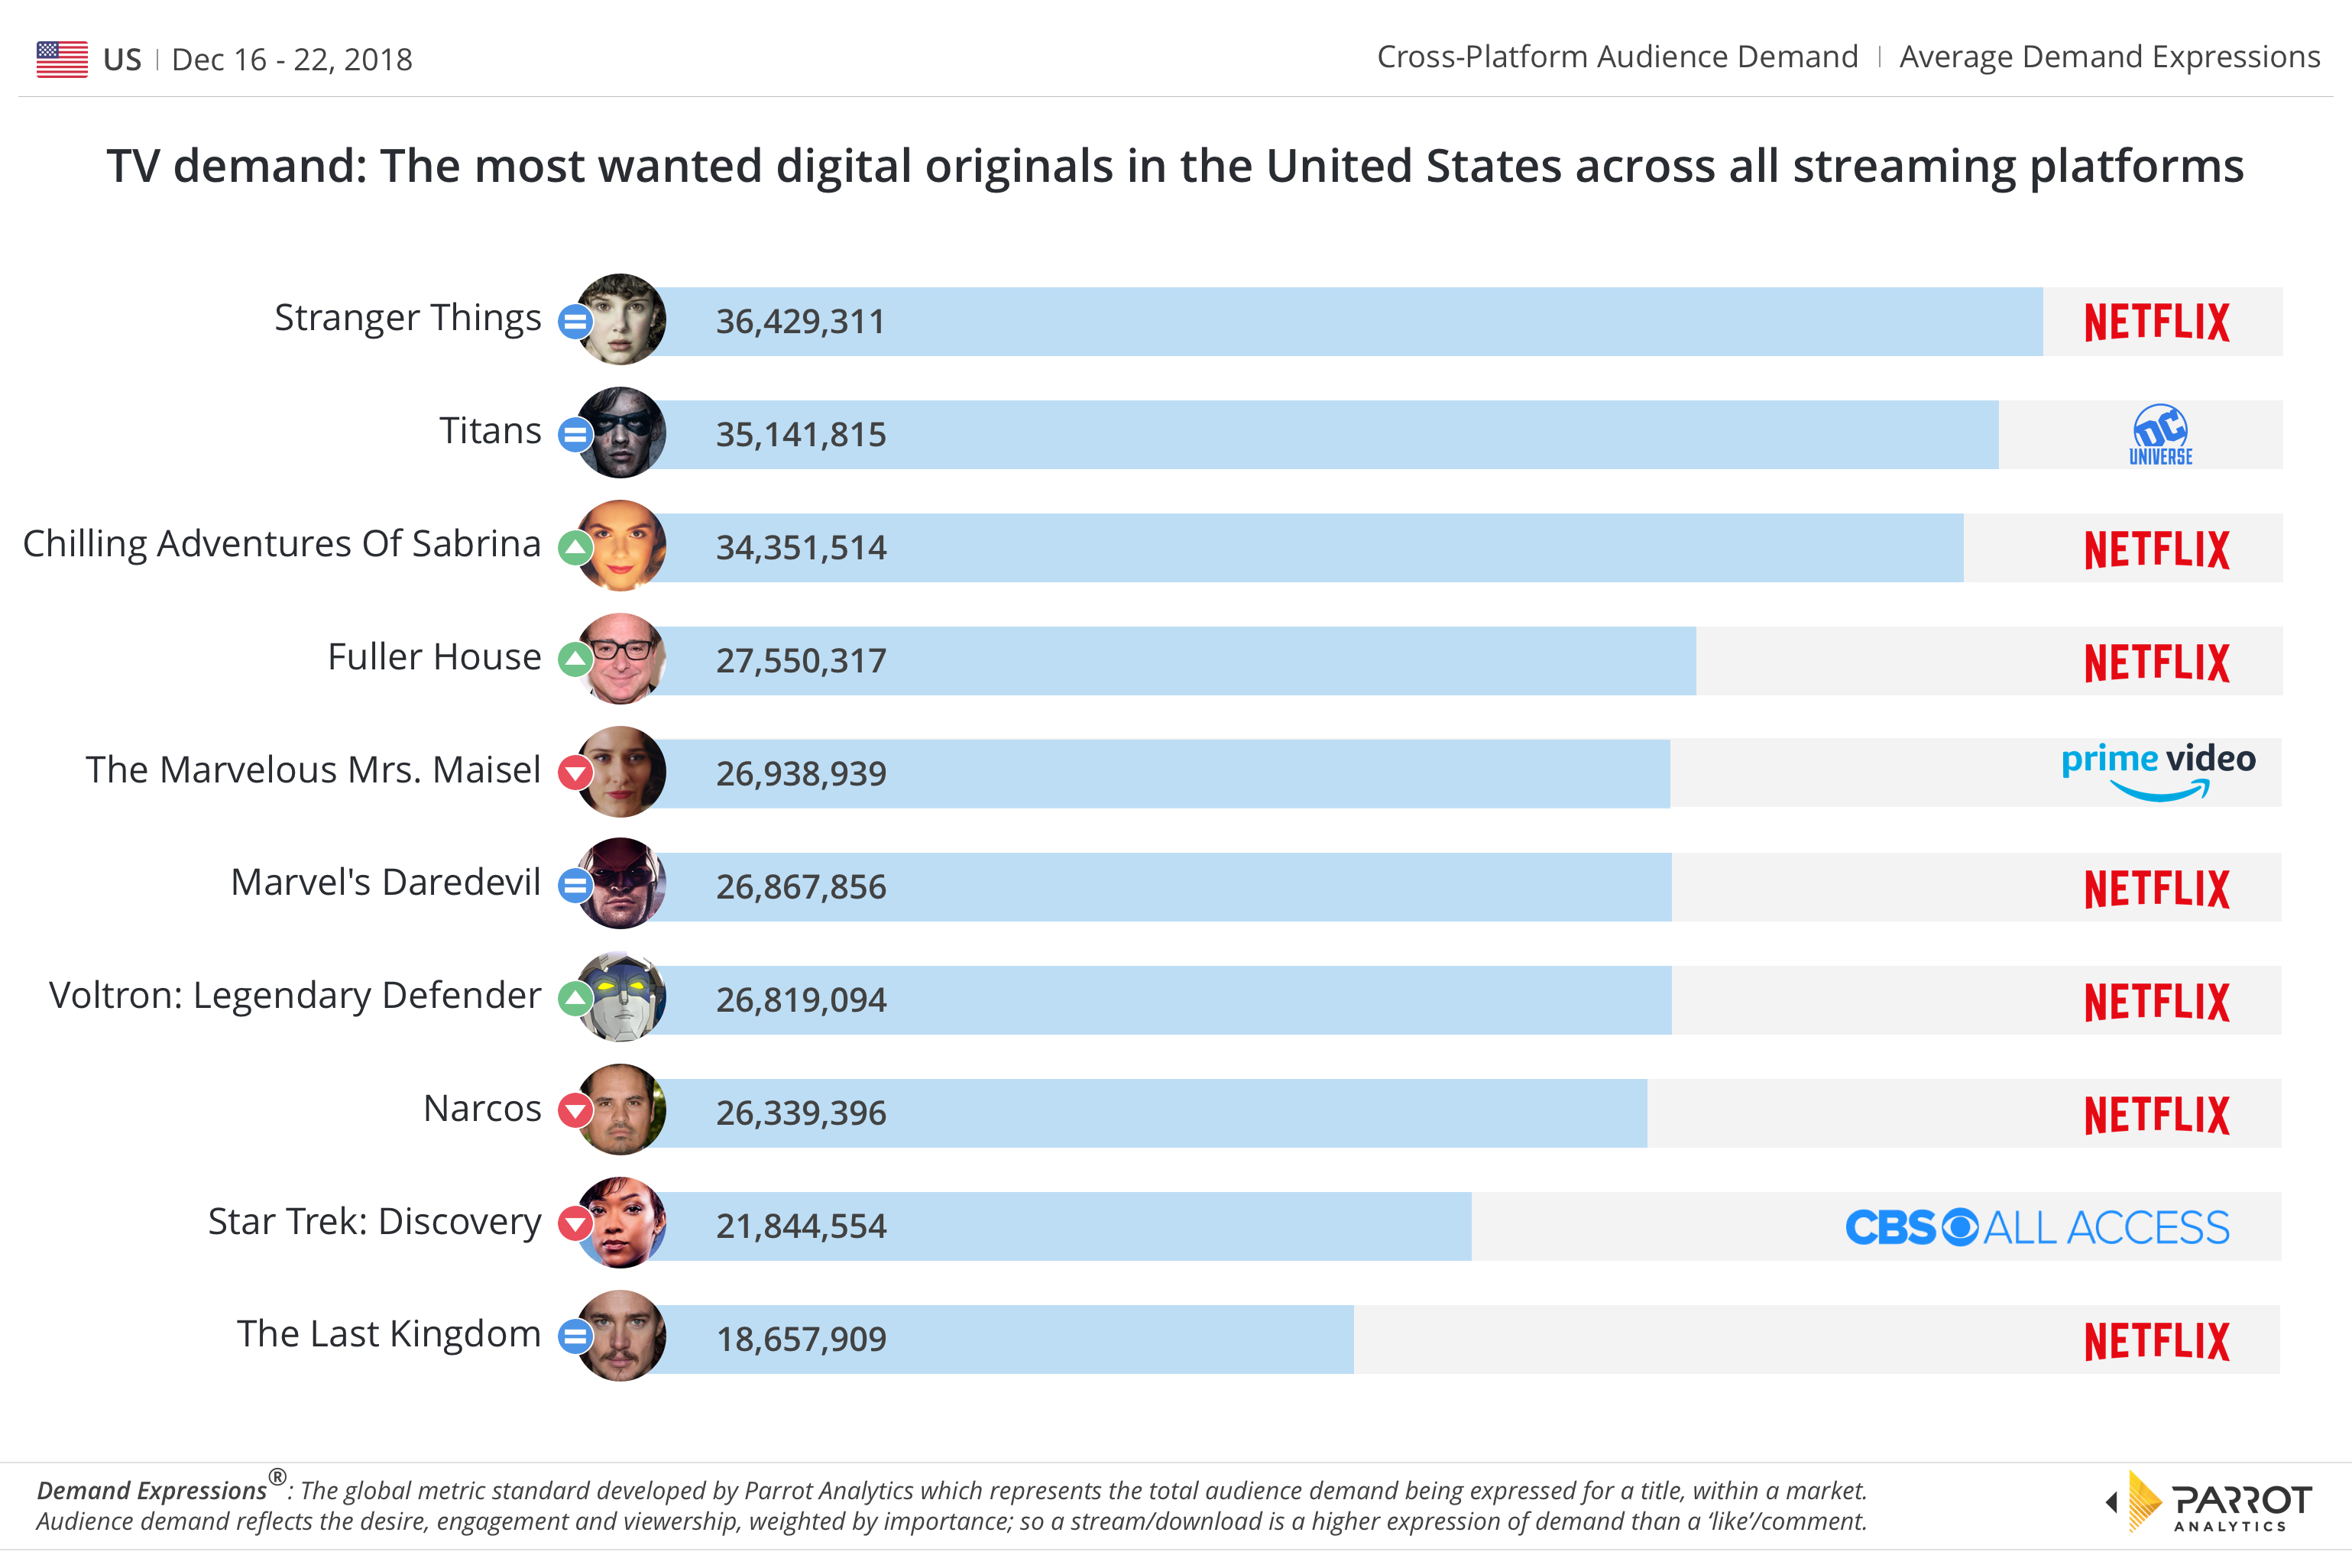
The biggest change in the digital series chart is Netflix’s sitcom Fuller House, which has had a strong increase in demand after Netflix released the show’s fourth season on December 14th. Compared to last week, Fuller House has risen 11 places in the chart from 15th to 4th and registered a 70% increase in its average demand from 16 to 27.5 million Demand Expressions.
At No. 3, Chilling Adventures Of Sabrina launched this year with much success. This week, the teen horror series gained 17% on the back of 16 new episodes being commissioned; these will air in two parts, similar to how Netflix split the show’s initial 20 episode order. Instead of differentiating the episodes as “Season 3” and “Season 4,” “Part 3” and “Part 4” will begin production in 2019. The show’s previously announced “Part 2” will premiere on April 5th, 2019.
Amazon Prime Video’s award-winning comedy The Marvelous Mrs. Maisel is the fifth most wanted digital original series with 26.9 million average daily Demand Expressions, down two places compared to last week.
On the overall chart, the most significant TV demand changes can be seen with CW’s The Flash, which is now in the middle of its fifth season, falling roughly 26% compared to the prior week which pushed the series into the eighth-most wanted position on the overall chart. Additionally, media personality Ellen DeGeneres re-enters the overall television demand chart this week with her self-titled daytime talk show, having 41.5 million average daily Demand Expressions.


