The TV industry is undergoing massive changes: as the number of content distribution platforms and consumer fragmentation grows, existing measurement services in the industry fall increasingly short. Everyone knows shows like The Walking Dead and Game of Thrones are popular because their Nielsen ratings are high, but what about OTT original series like House of Cards? By measuring demand for TV shows globally, we can fairly and quantitatively compare the popularity of linear and OTT titles.
What is demand?
Demand for shows is what drives consumption on all platforms – linear and OTT alike. People express their demand for certain titles in many ways, including video streaming, social media, and file-sharing platforms, and Parrot’s Demand Expressions™ are a country-specific, numerical representation of this demand.
Lifecycle of a TV series
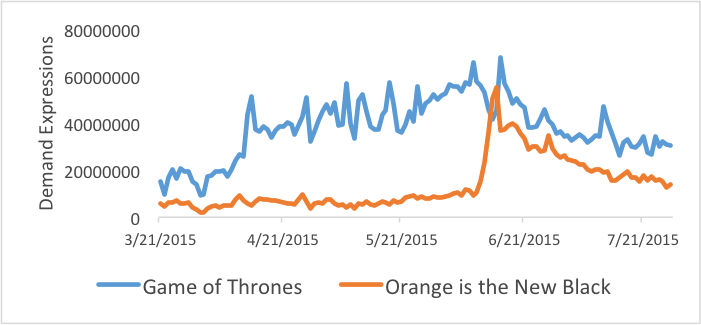
To understand how demand for a specific series behaves during its airing, we explore the difference in demand between a show on a linear TV channel, Game of Thrones, and a show on an OTT platform, Orange is the New Black, in the United States.

Game of Thrones aired from April 12 to June 14, 2015: clear increases in demand correspond to both the premiere and finale, with steadily rising demand during the season. Each weekly episode seems to create its own small spike in demand as well. After the season ended, demand slowly decreases.
The third season of Orange is the New Black was released on June 11, 2015. In contrast to Game of Thrones, it did not have a slow increase in demand before its premiere but instead has a single large spike on release. As all episodes were available at once, demand immediately starts trailing off as people watched the season at their own pace.
Linear and OTT series clearly exhibit different patterns of demand related to their release strategies. Demand for Game of Thrones, with its traditional one episode a week, rises throughout the season as anticipation for the always-surprising final episodes grows. On the other hand, demand for Orange is the New Black has one major spike then steady decline, as Netflix’s strategy of releasing all episodes at once prevents the same hype from building up. While demand for Orange is the New Black is strong for a few days, demand for Game of Thrones is sustained over a few months. This conclusion means that, though the two shows have similar levels of demand, we expect Game of Thrones to have more viewers over time.
– Kayla Hegedus, Data Scientist

