Parrot Analytics has recently taken an in-depth look at the most popular TV series produced by SVOD platforms in the United States by leveraging Parrot Analytics global TV demand data.
Please download the full 68 page report here, which also includes data and analysis for 9 other countries: United States digital TV series 2018 report.
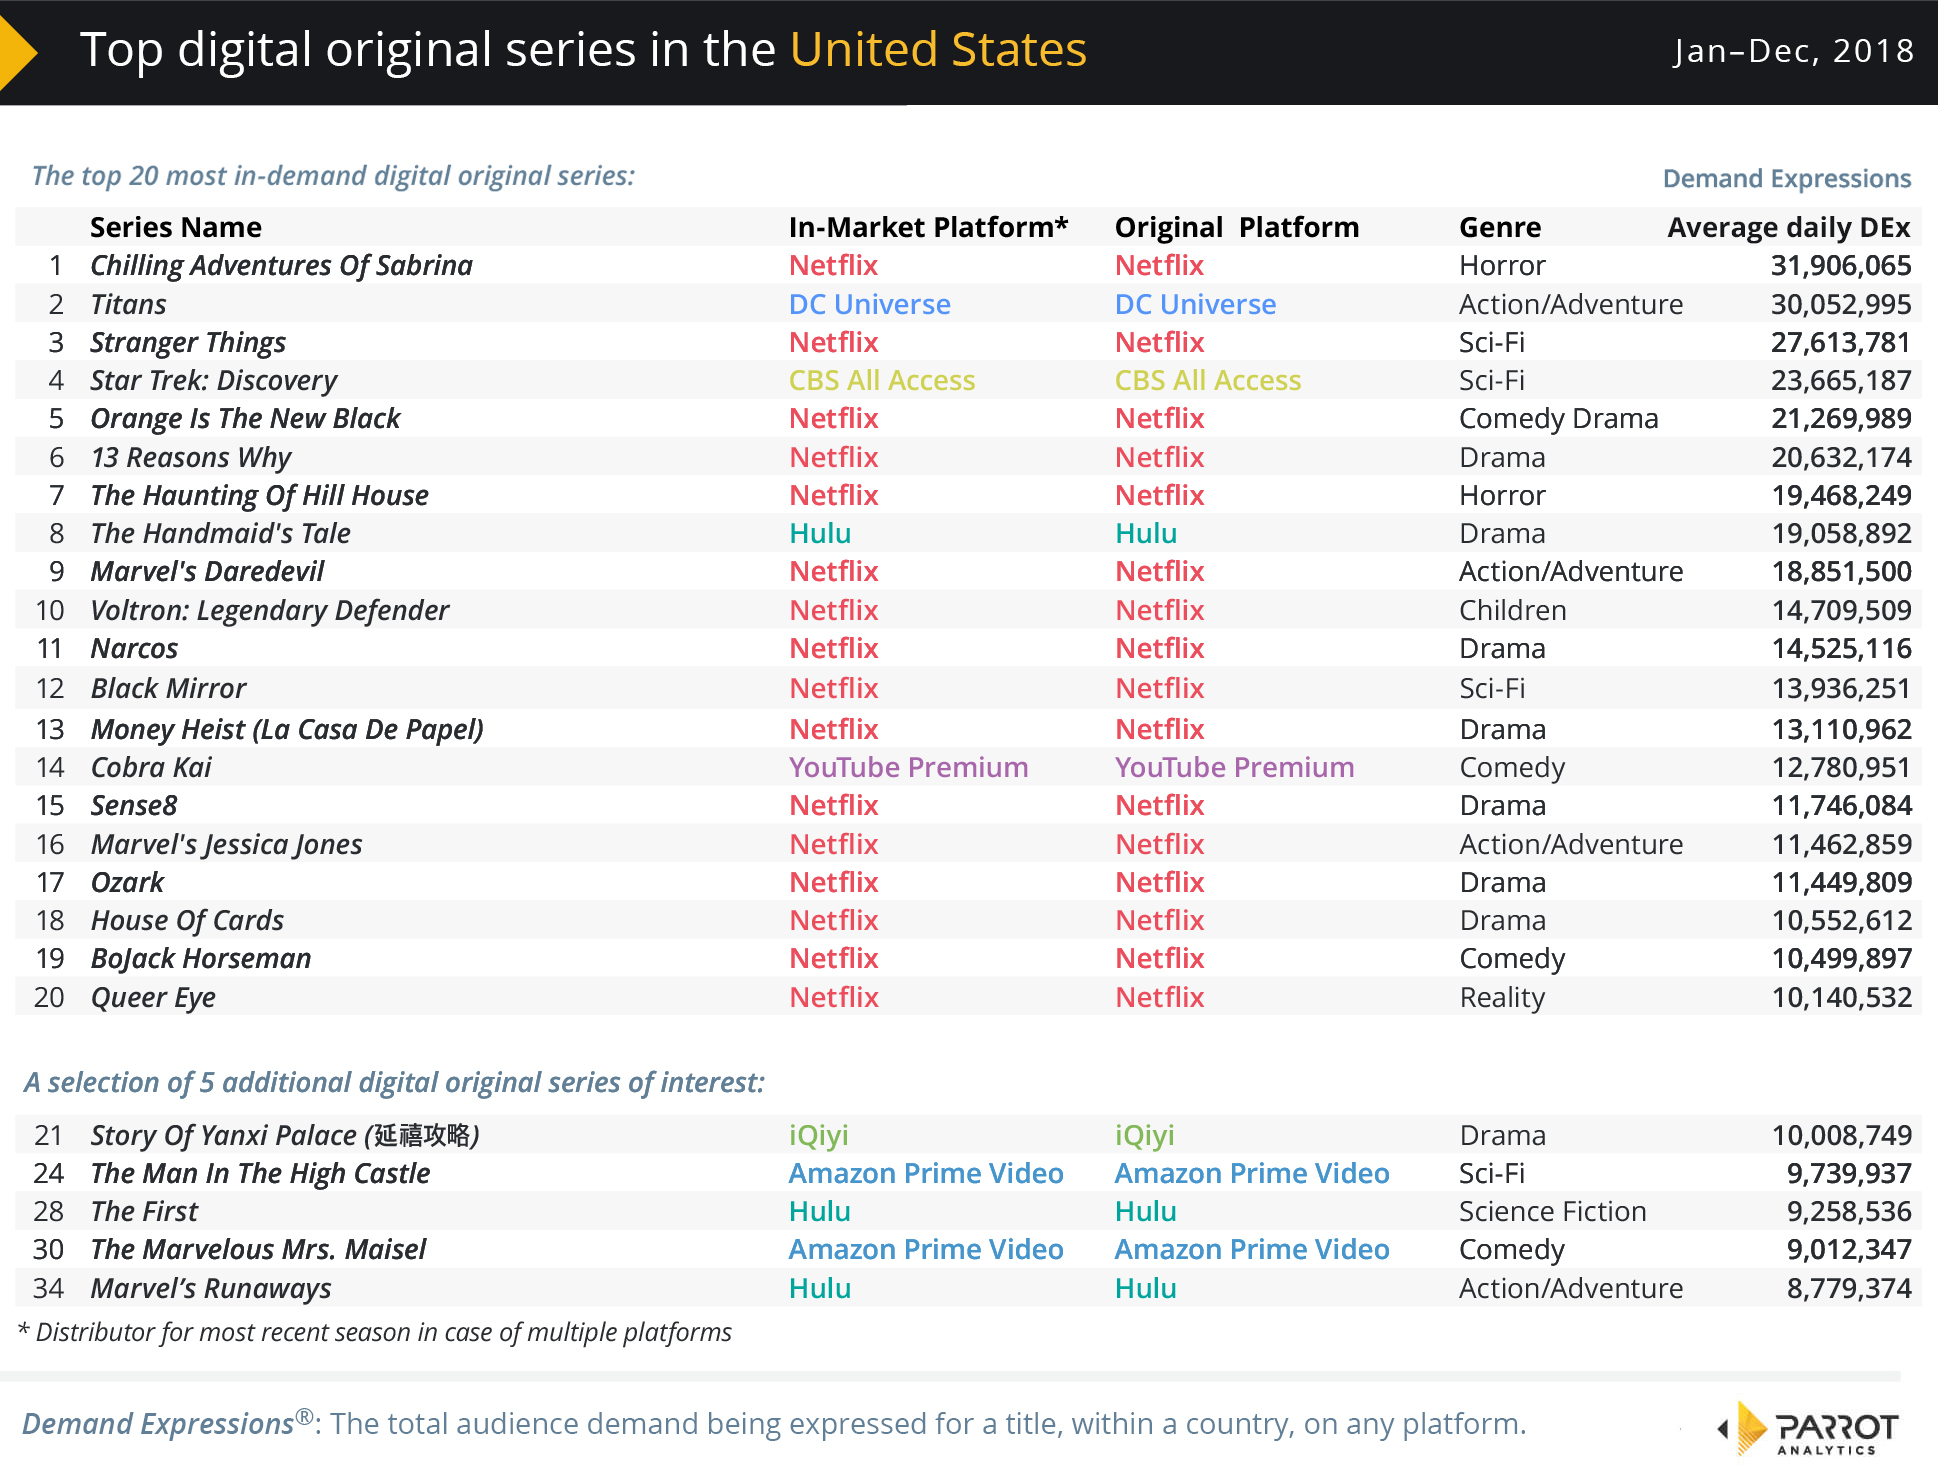
The top 20 most popular Netflix Originals, Amazon Prime Video Originals, Hulu Originals and more in the United States
We measure the audience demand for television content around the world, factoring in all of the following and more:
- Audience video consumption (streaming and downloads)
- Social media engagement (hashtags, liking, sharing)
- Consumer research actions (reading about shows, writing about shows, etc)
Demand for content is calculated daily for tens of thousands of TV shows in 100+ markets across all television distribution platforms: The more consumer effort is required, the more importance we attach to each of the factors above.
This approach results in the industry’s most advanced global TV demand measurement system, allowing us to provide insights on TV series that audiences the world over truly care about.
So, with all that in mind, here are our top 20 digital originals for the United States in 2018:
Just how popular are the most in-demand originals from Netflix, Amazon Prime Video, Hulu, etc?
We define a digital TV series as a “digital original”: A multi-episode series where the most recent season was produced or first made available on a streaming platform.
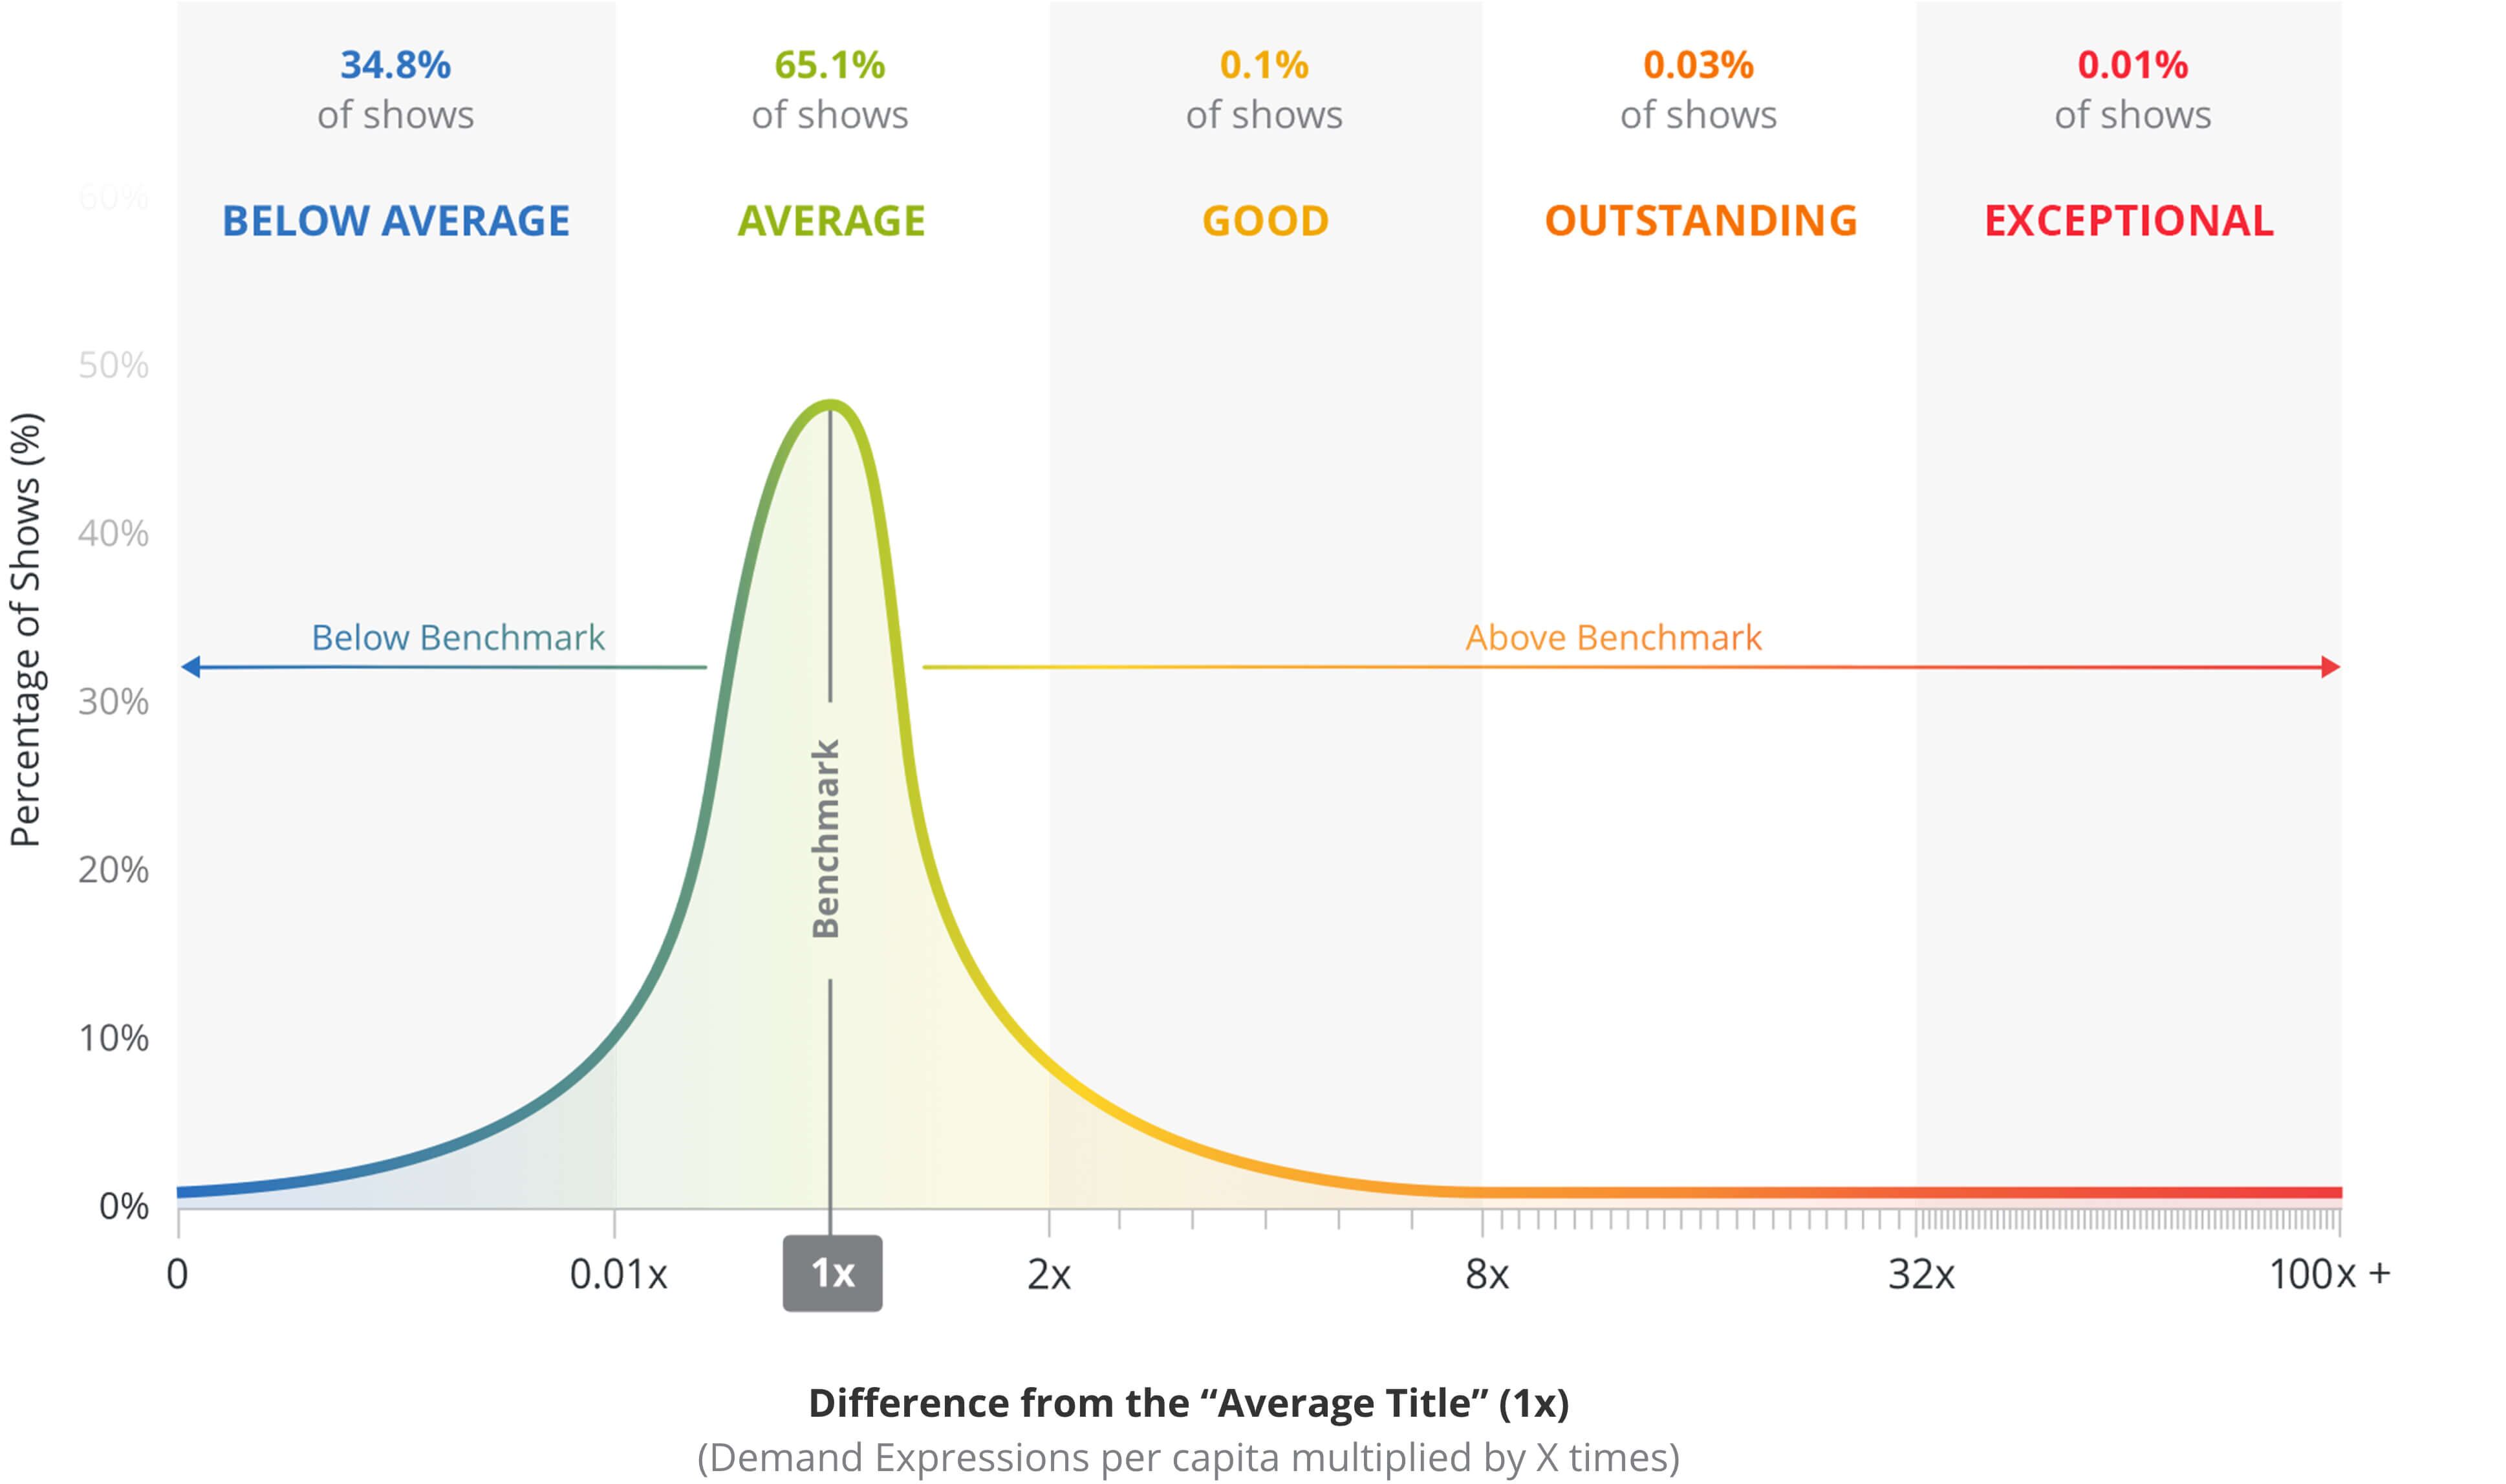
By analyzing each TV series’ demand relative to the market average, we are able to classify each TV show into one of the following television series performance categories:
- Below average (34.8% of all TV shows in the United States)
- Average (65.1% of all TV shows in the United States)
- Good (0.1% of all TV shows in the United States)
- Outstanding (0.03% of all TV shows in the United States)
- Exceptional (0.01% of all TV shows in the United States)
The resulting demand distribution curve illustrates how a TV show’s popularity compares to the demand benchmark, which is a measure of the average demand across all titles.
The Parrot Analytics TV content demand distribution curve
A TV show in the United States falls into one of the following performance buckets depending on how many times more or less demand it has compared to the market demand benchmark:
A TV show’s performance is market-specific, e.g. the same show can be in the “Average” range in the United States and in the “Good” range in France. As an example, if a show has 9 times more demand than the demand benchmark, it falls in the “Outstanding” performance range; only 0.03% of all shows in the market reach this high level of demand.
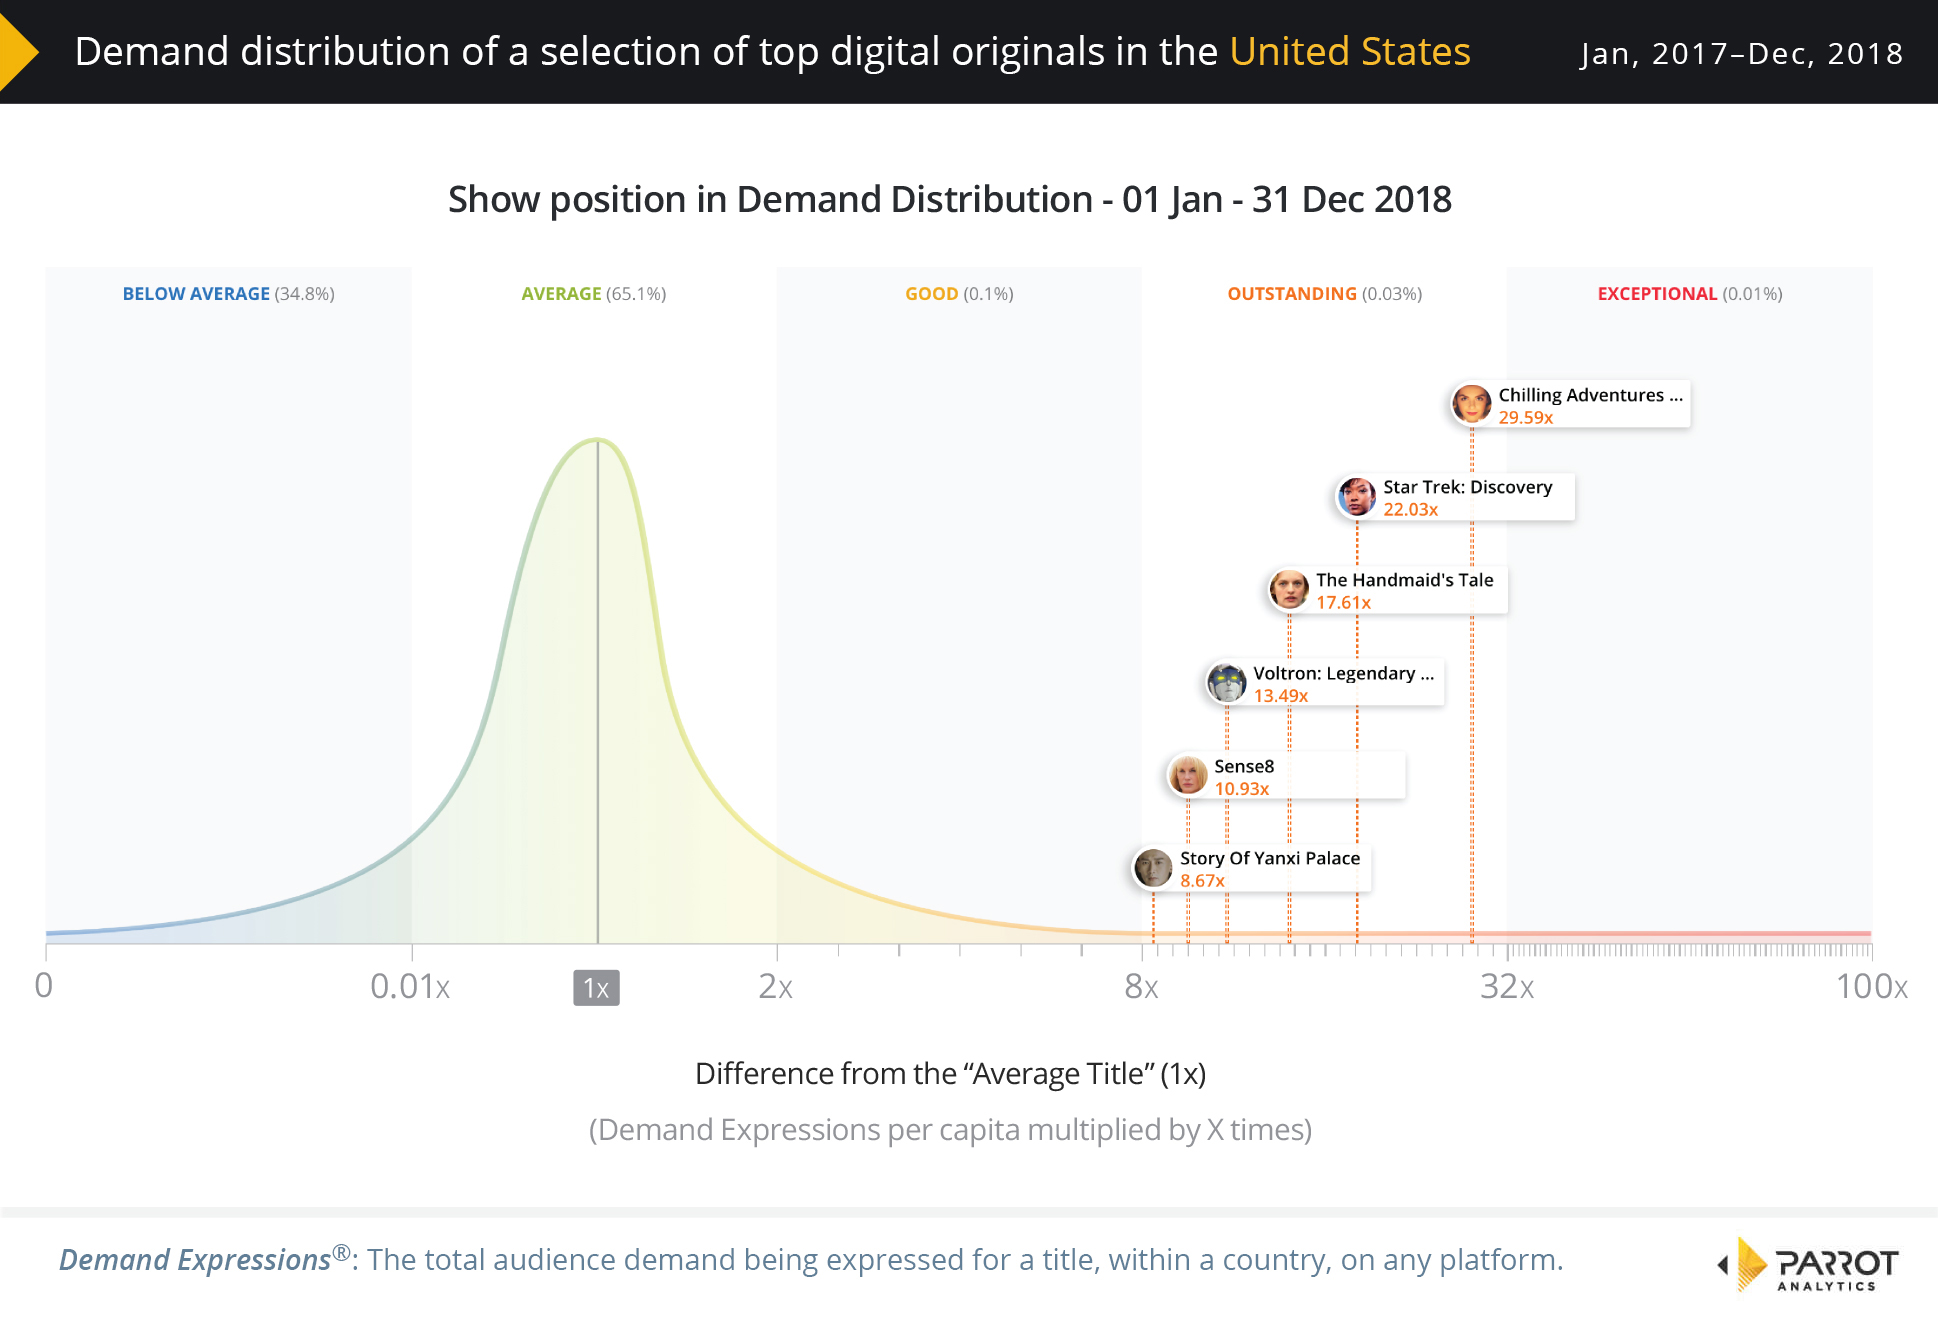
The demand distribution of a selection of digital originals in the United States
We are therefore able to make the following observations concerning the top digital originals for 2018 in the United States:
- Despite being released late in 2018, Netflix’s Chilling Adventures Of Sabrina is the most in-demand digital original in the US with close to 30 times the demand of an average title. We refer to this simply as “Outstanding” demand.
- Children’s title Voltron had a strong appeal with US audiences in 2018 and the feature-length conclusion to Sense8 helped this series also rank highly over the year.
- Asian-market phenomenon Story Of Yanxi Palace also made waves in the US market, ranking 21st in demand for 2018.
Download the free Parrot Analytics Global Television Demand Report
Download this report now and discover the latest TV travelability and subgenres data trends for the United States. Our comprehensive global TV demand report includes the following insights:
United States Domestic TV Insights:
- We reveal the 2018 United States SVOD market share of the major platforms including Netflix, Amazon Prime Video, Hulu and CBS All Access based on audience demand for each platform’s digital originals.
- Discover how SVOD market share trends in the U.S. have changed over the last 24 months, including the contribution made by DC Universe.
- Find out what percentage of the market for drama and action/adventure digital originals each SVOD platform has managed to capture over the last 24 months.
- Learn where in the world content produced in the United States is the most wanted relative to the U.S. home market; we refer to this as content travelability.
- Discover which sub genres resonate the most with Americans compared to the global average.
- Find out what the demand distribution of a selection of digital originals in the United States looks like.
- Discover the top 20 digital streaming shows in the United States, as well as 5 additional titles of interest to audiences in the USA.
Global Television Insights:
- Find out the 2018 global SVOD market share of the major platforms including Netflix, Amazon Prime Video, Hulu and CBS All Access across 100+ markets.
- Discover the worldwide platform demand share of drama digital originals as well as the worldwide platform demand share of action/adventure digital originals.
- The increase in the global investment made by SVOD platforms over the last 5 years.
- The global growth of SVOD subscribers over the last 5 years.
- The increase in digital original titles worldwide over the last 7 years.
- A TV industry update for 2018 detailing important market events concerning SVOD services.
- We have also included a mini analysis of the global demand for critically acclaimed digital original comedies.
For more information, check out the most up-to-date United States television industry overview.


