Parrot Analytics has recently taken an in-depth look at the most popular streaming television series produced by SVOD platforms in the United States by leveraging Parrot Analytics global TV demand data.
Please download the full 60 page report here, which also includes data and analysis for 9 other territories: United States streaming TV series report.
The top 20 SVOD original television series in the United States
We measure the audience demand for television content around the world, factoring in all of the following and more:
- Audience video consumption (streaming and downloads)
- Social media engagement (hashtags, liking, sharing)
- Consumer research actions (reading about shows, writing about shows, etc)
Demand for content is calculated daily for tens of thousands of TV shows in 100+ markets across all television distribution platforms: The more consumer effort is required, the more importance we attach to each of the factors above.
This approach results in the industry’s most advanced global TV demand measurement system, allowing us to provide insights on TV series that audiences the world over truly care about.
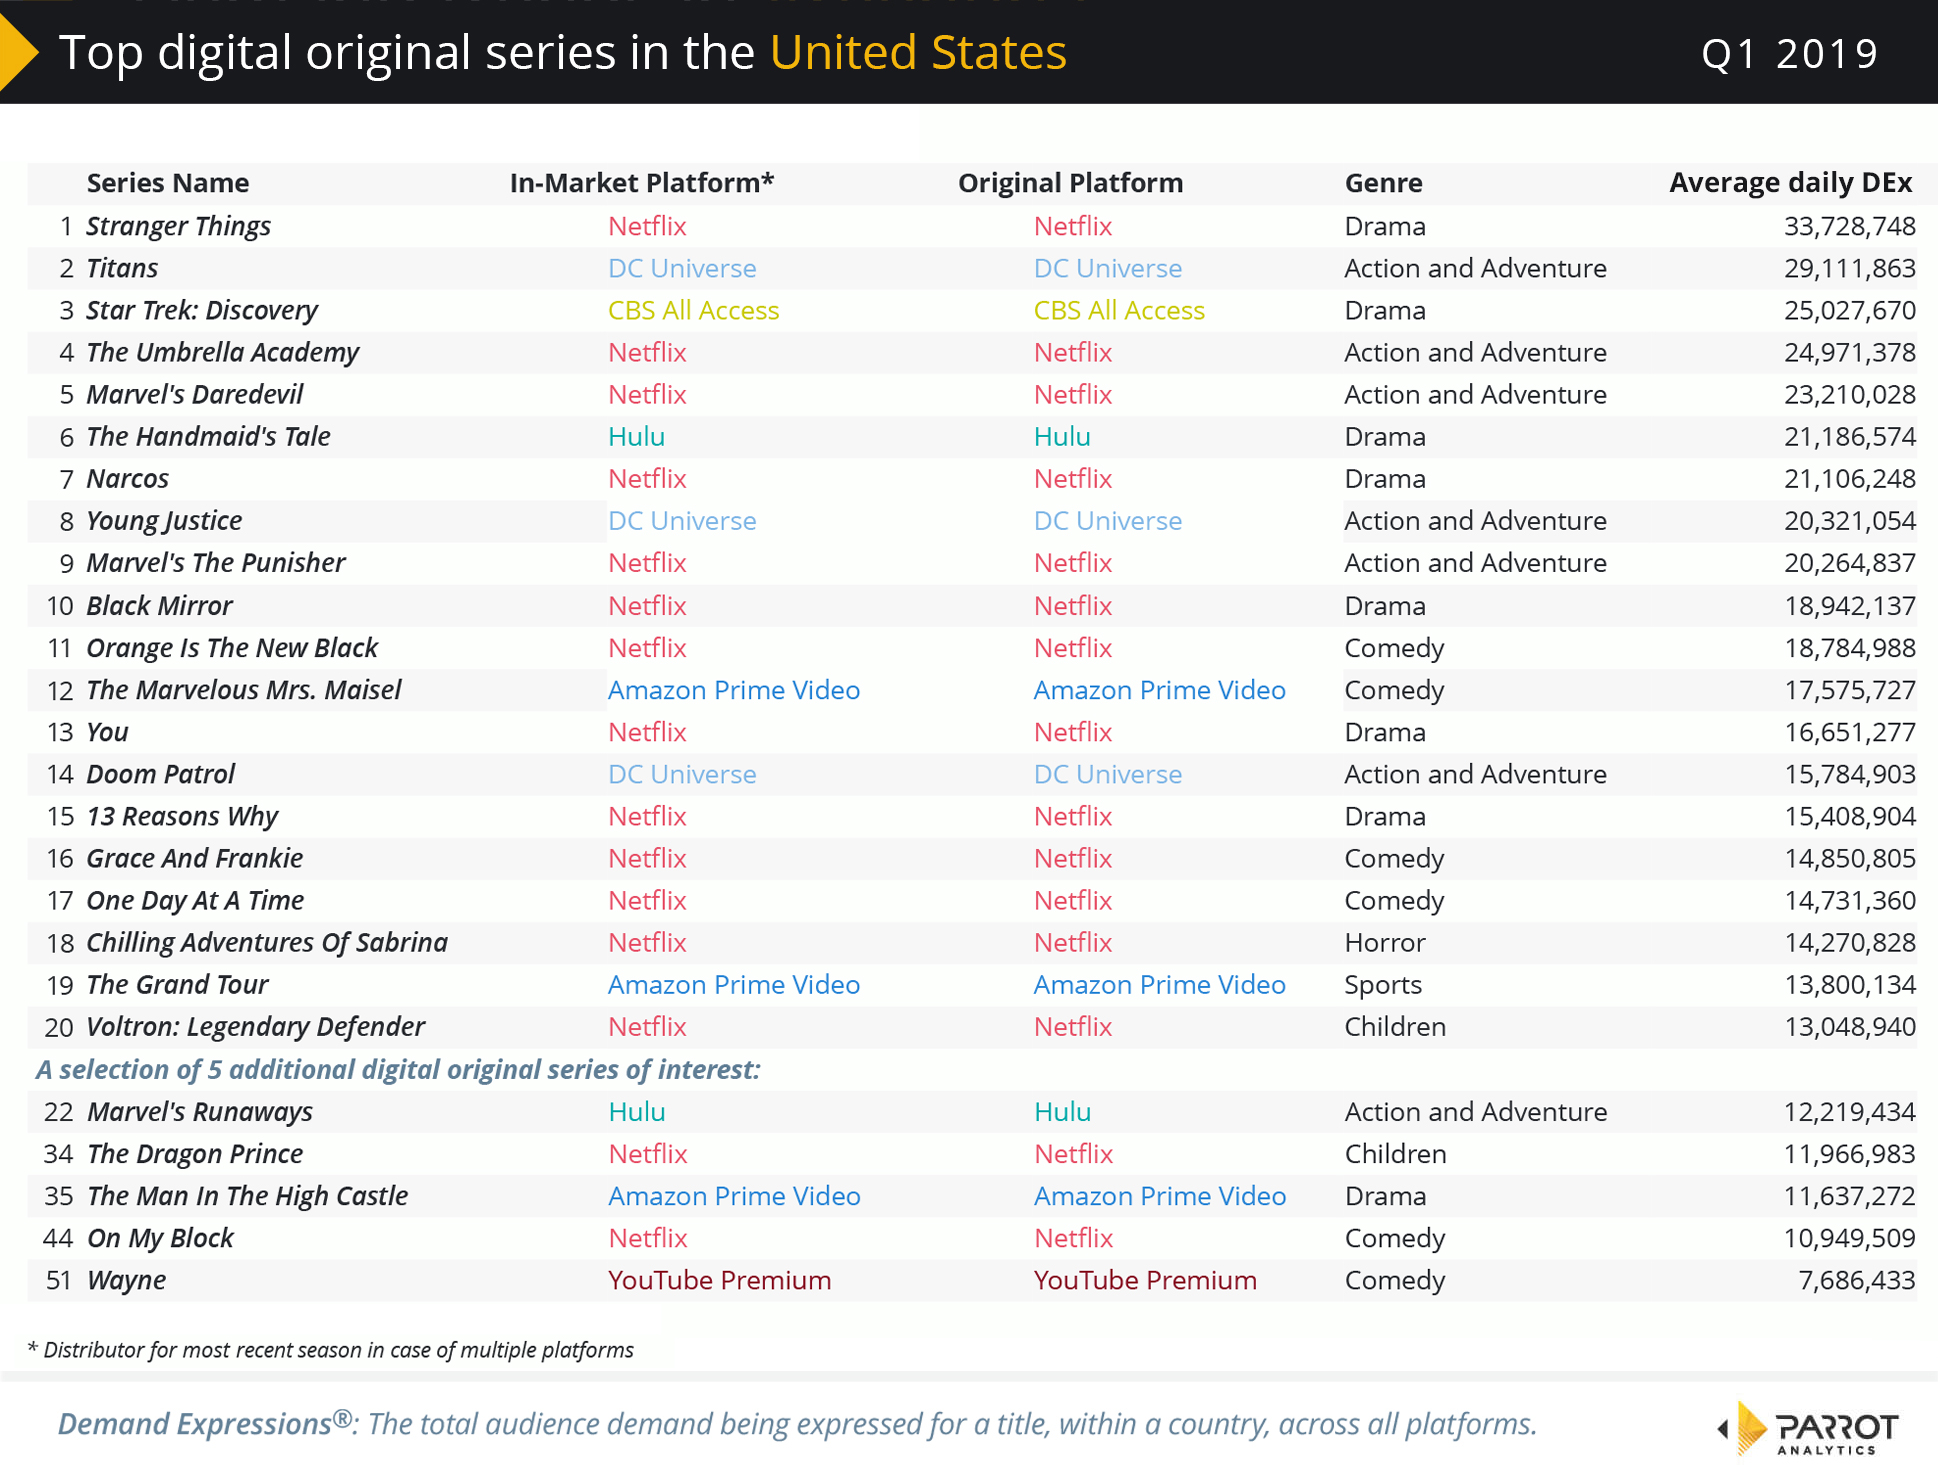
So, with all that in mind, here are our top 20 original TV series by a streaming platform for the United States for Q1 2019:
Which Netflix, Amazon Prime Video and Hulu series are most popular?
We define a streaming original series as a multi-episode series where the most recent season was produced or first made available on a streaming platform.
By analyzing each TV series’ demand relative to the market average, we are able to classify each TV show into one of the following TV series performance brackets:
- Below average (22.4% of all TV shows in the United States)
- Average (64.1% of all TV shows in the United States)
- Good (8.6% of all TV shows in the United States)
- Outstanding (2.7% of all TV shows in the United States)
- Exceptional (0.02% of all TV shows in the United States)
The resulting TV audience demand distribution illustrates how a TV show’s popularity compares to the demand benchmark, which is a measure of the average demand across all titles.
The Parrot Analytics TV content demand distribution curve
A TV show in the United States falls into one of the following performance buckets depending on how many times more or less demand it has compared to the market demand benchmark:
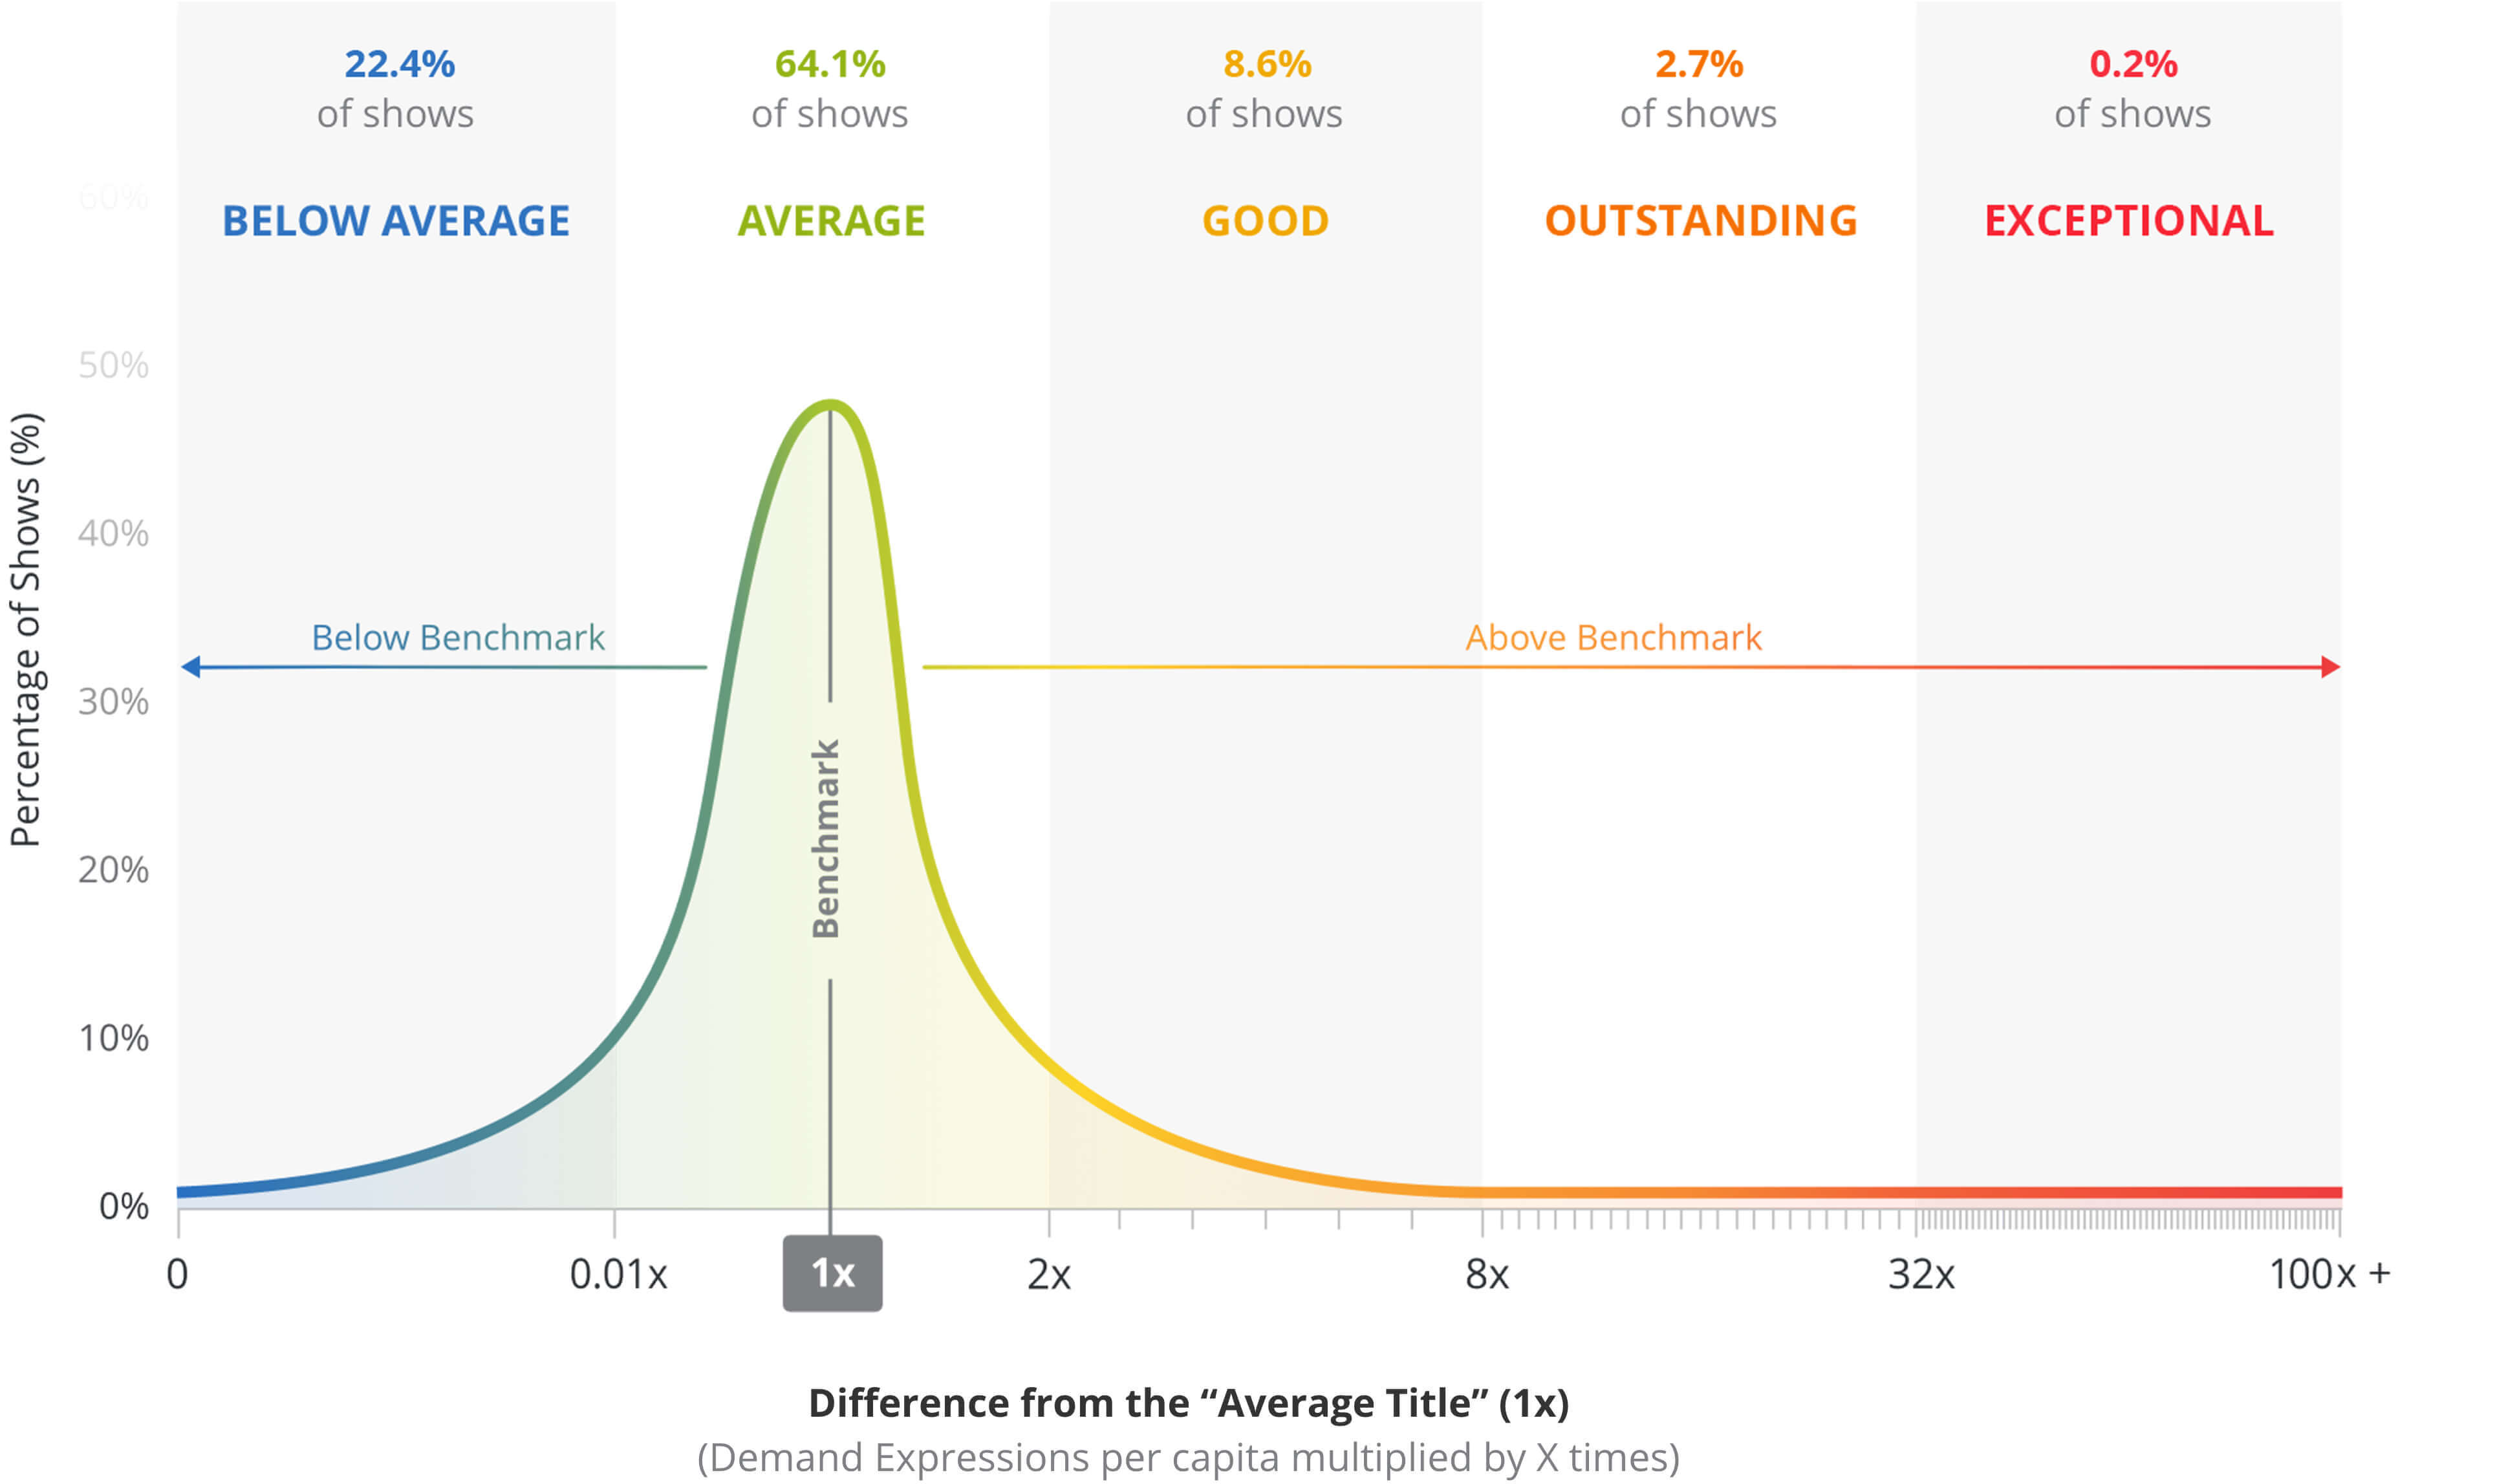
A TV show’s performance is market-specific, e.g. the same show can be in the “Average” range in the United States and in the “Good” range in France. As an example, if a show has 9 times more demand than the demand benchmark, it falls in the “Outstanding” performance range; only 2.7% of all shows in the market reach this high level of demand.
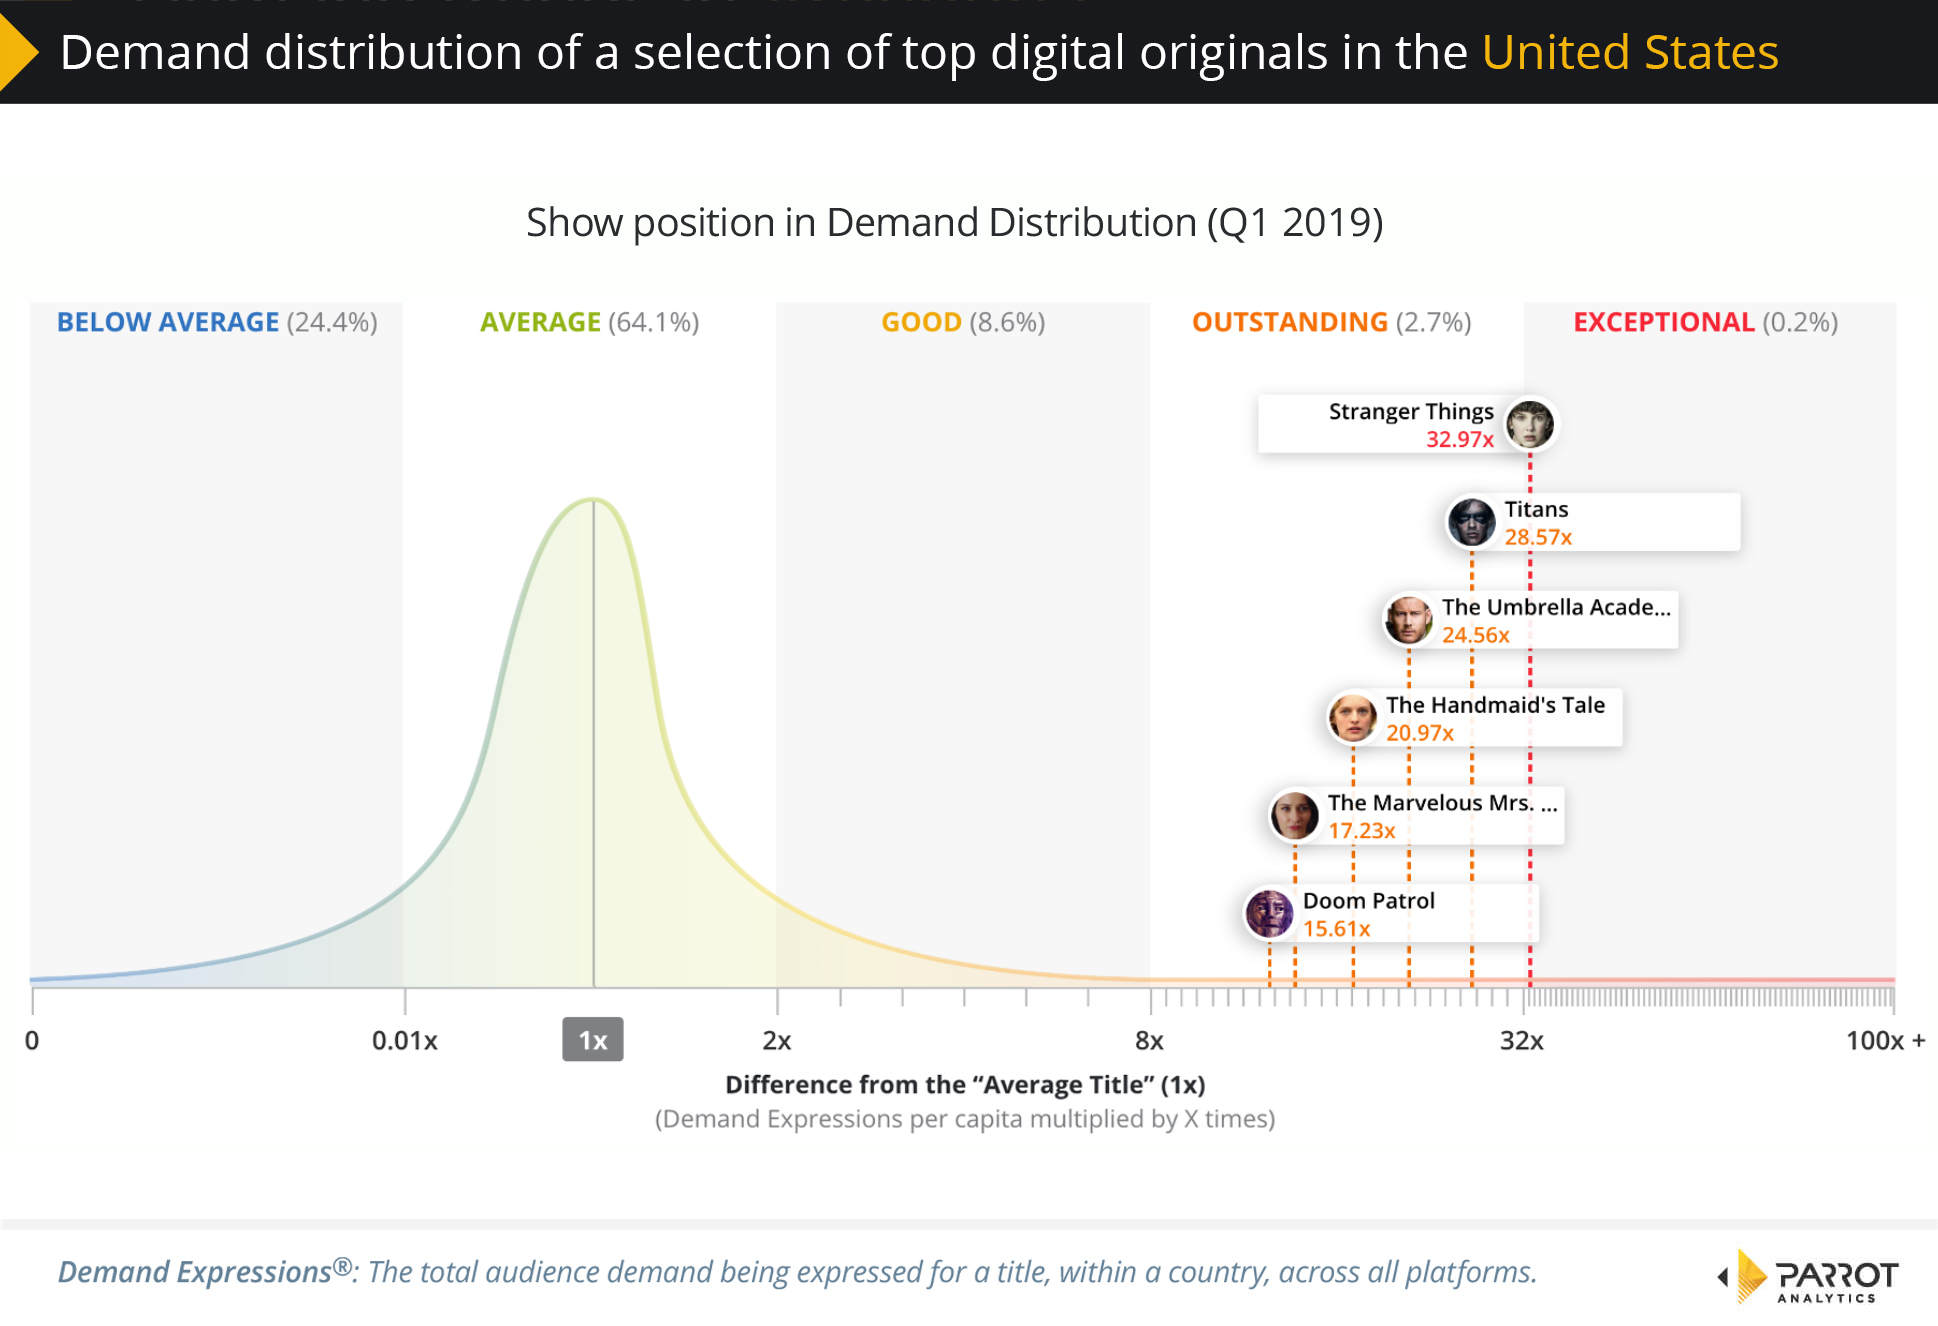
The audience demand for streaming original TV series in the United States
We are therefore able to make the following observations concerning the top streaming television series for Q1 2019 in the United States:
- The most in demand digital original series in the United States in 2019 Q1 is Netflix’s Stranger Things. It has 33.0 times more demand than the average title, making it one if the 0.2% of titles that are classed as ‘Exceptional’.
- Two titles that premiered in the middle of the quarter achieved high demand in the US, DC Universe’s Doom Patrol and Netflix title The Umbrella Academy, both of which premiered on February 15th.
- Demand for Amazon Prime Video’s comedy The Marvelous Mrs. Maisel remains high after season 2 was released at the end of last quarter. It had over 17.2 times more demand than the average title in Q1.
Download the free TV streaming platform report for the United States
Download this report now and discover the latest SVOD market demand trends for the United States. Our comprehensive global TV demand report includes the following insights:
United States Domestic TV Insights:
- We reveal the United States SVOD market share of the major platforms including Netflix, Amazon Prime Video, Hulu and CBS All Access based on audience demand for each platform’s digital originals.
- Discover how SVOD market share trends in the United States have changed over the last 24 months.
- Find out what percentage of the market for drama and action/adventure digital originals each SVOD platform has managed to capture over the last 24 months.
- Discover the genre demand share for all digital originals in this market as well as the 10 most in-demand subgenres in this territory.
- Find out the demand distribution of a selection of digital originals in this market.
- Discover the top 20 digital streaming shows in the United States, as well as 5 additional titles of interest to audiences.
Global Television Insights:
- Find out the global SVOD market share of the major platforms including Netflix, Amazon Prime Video, Hulu and CBS All Access across 100+ markets; this has been calculated based on the worldwide demand for each platform’s originals.
- A TV industry update for Q1 2019 detailing important market events concerning SVOD services.
- This report also includes data for the following additional territories: Belgium, China, Hungary, Ireland, Japan, Netherlands, Russia, South Africa and the United Kingdom.
Note: This version of The Global TV Demand Report does not include any market share information for as yet unreleased SVOD platforms such as Apple TV+ (Apple TV Plus), HBO Max by WarnerMedia / AT&T, NBCU / Comcast’s Peacock, Quibi and Disney+.
For more information, check out the most up-to-date United States television industry overview.

