Parrot Analytics has recently taken an in-depth look at SVOD TV trends in the United States.
Download this report now and discover what television content people really want in the United States. Our comprehensive global TV demand report includes the following insights on SVOD digital originals and TV device access preferences:
- The top 20 digital streaming shows in the United States, as well as 5 additional titles of interest to the Americans.
- How local demand in the United States for these titles has changed over the course of the second quarter of 2018.
- How audiences’ TV series consumption by device varies in the United States, including a breakdown of age and gender.
- A TV industry update for Q2 detailing important events with a focus on OTT.
- An overview of all the new streaming series that were released in the second quarter of 2018.
- This report also includes data for the following additional territories: New Zealand, Austria, Colombia, Canada, Germany, Malaysia, Poland, Portugal, United Kingdom.
Top Streaming Television Shows in the United States
In the United States TV report, the top 20 digital original series and 5 series of interest have been ranked by their average Demand Expressions from April through May, 2018. A time series plot illustrating interesting OTT demand trends in the United States over the last three months is also included:

Our observations:
- 13 Reasons Why was increasing consistently in demand beginning in late April as the May 18th release date for the highly anticipated 2nd season neared.
- Out of the titles featured, YouTube Premium’s Cobra Kai experienced the sharpest increase in demand post its release.
- Sense8 drove its highest demand peak post the release of the 2 hour finale on Netflix in June. It’s second highest demand peak was following the announcement that there would be a finale episode in April.
- The Handmaid’s Tale generated consistent demand beginning in April, likely due to its episodic release format.
Devices used to access TV content in the United States
Our global TV demand report also includes a section on how audiences’ TV series consumption by device varies in the United States, including a breakdown of age and gender.
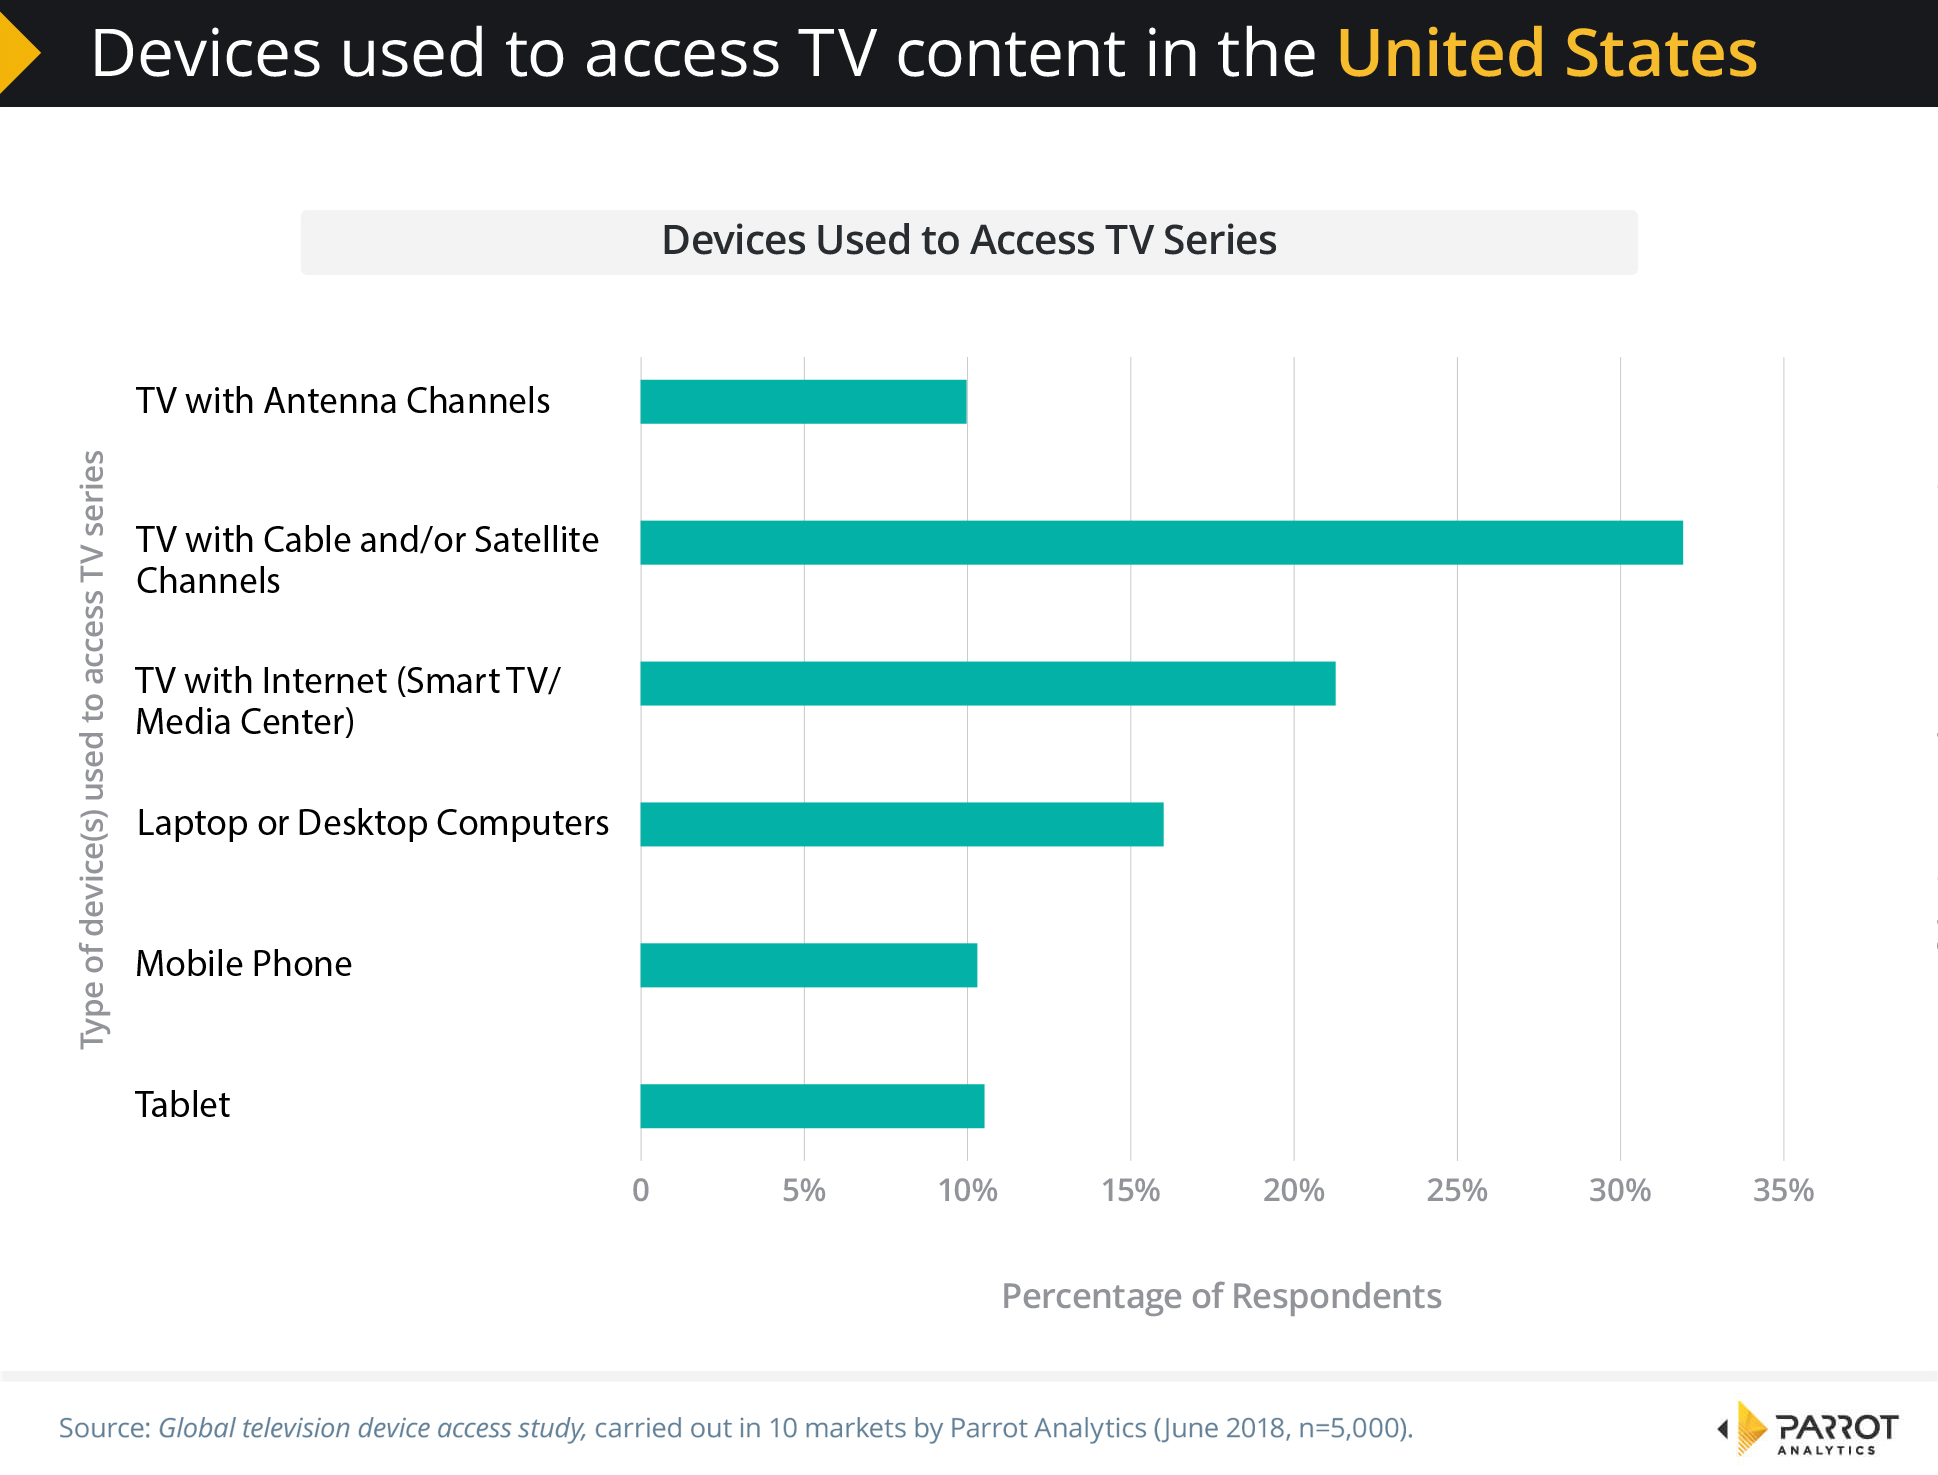
Our observations:
- The US has one of the highest reported rates of Smart TV usage (21%).
- While most devices were relatively closely split across gender, watching “TV with Antenna Channels” skewed more male (64% M vs. 36% F)
- Interestingly, the US has one of the most even distribution across the age brackets, suggesting audiences across all ages are engaging with television content across most devices.
- The 18-24 year-old bracket reported a tiny incidence of watching TV content on a regular TV – when they do watch on a TV screen its most likely a Smart TV.
For more information, check out the most up-to-date United States television industry overview.

