Image: Marvel’s Iron Fist, Netflix
Parrot Analytics’ demand measurement platform uses global TV demand data to help assess title demand across multiple platforms including TVOD, broadcast and cable television. Let us now look at the latest TV demand data for the U.S. domestic market.
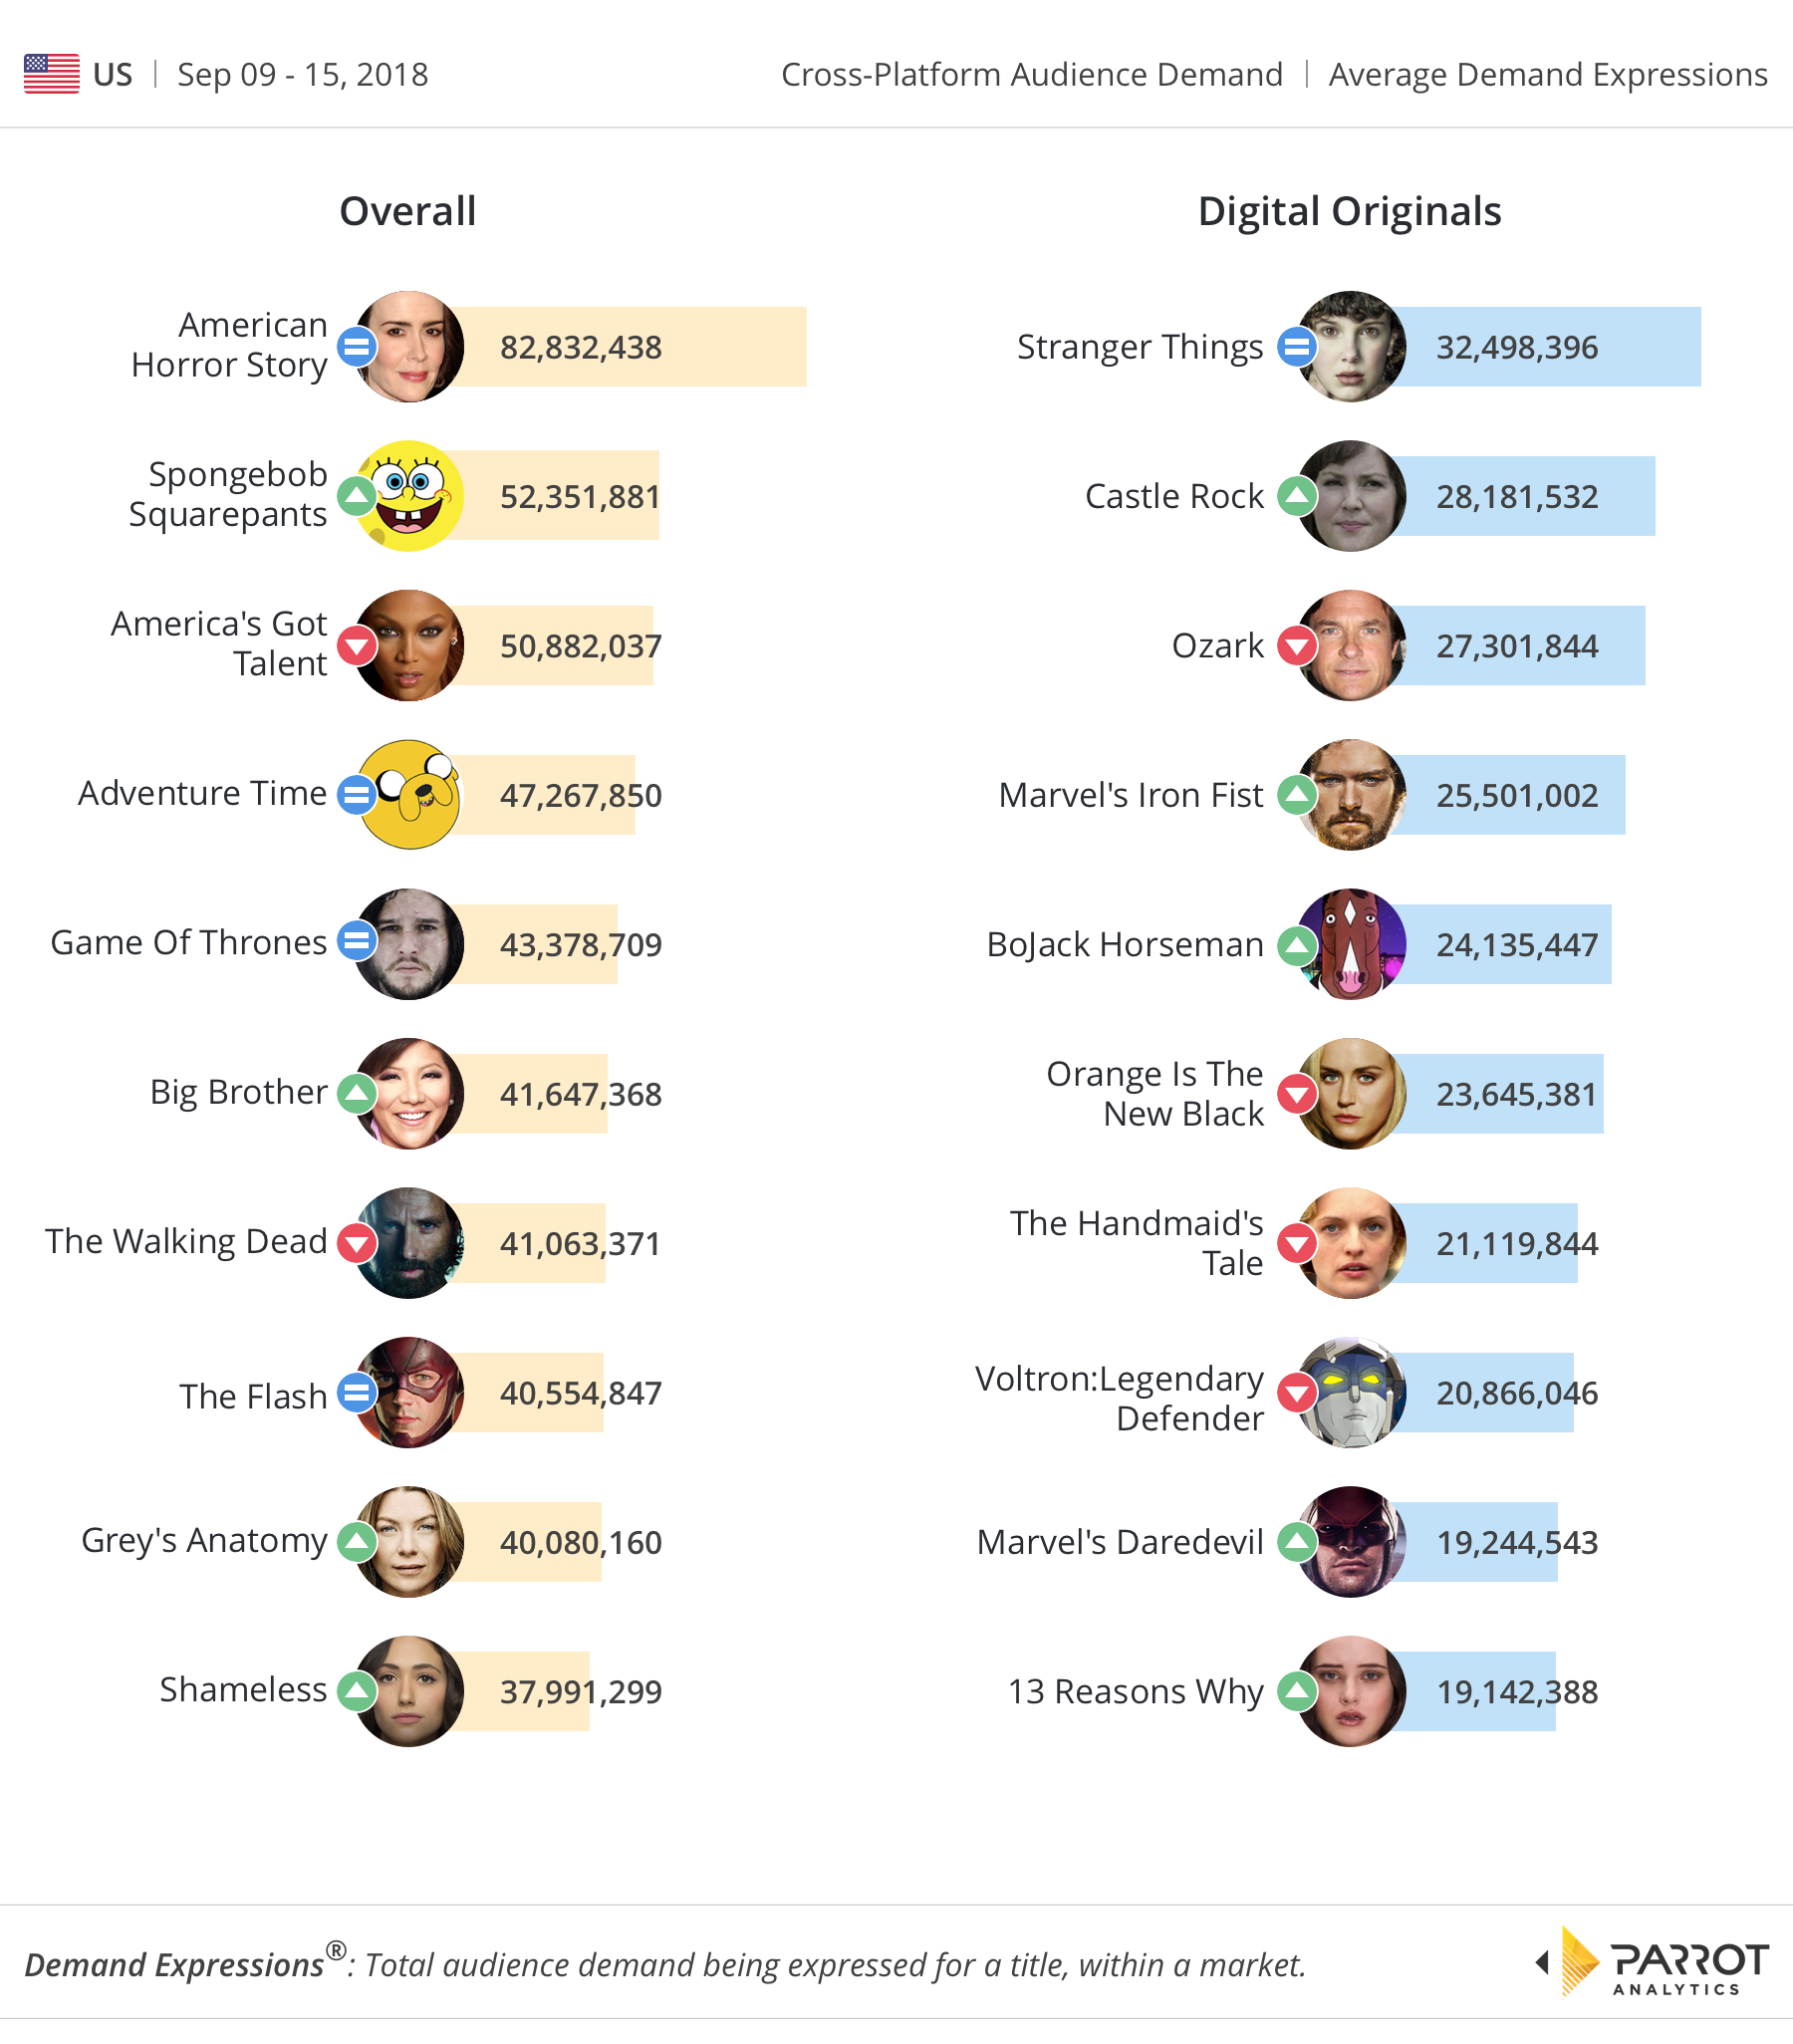
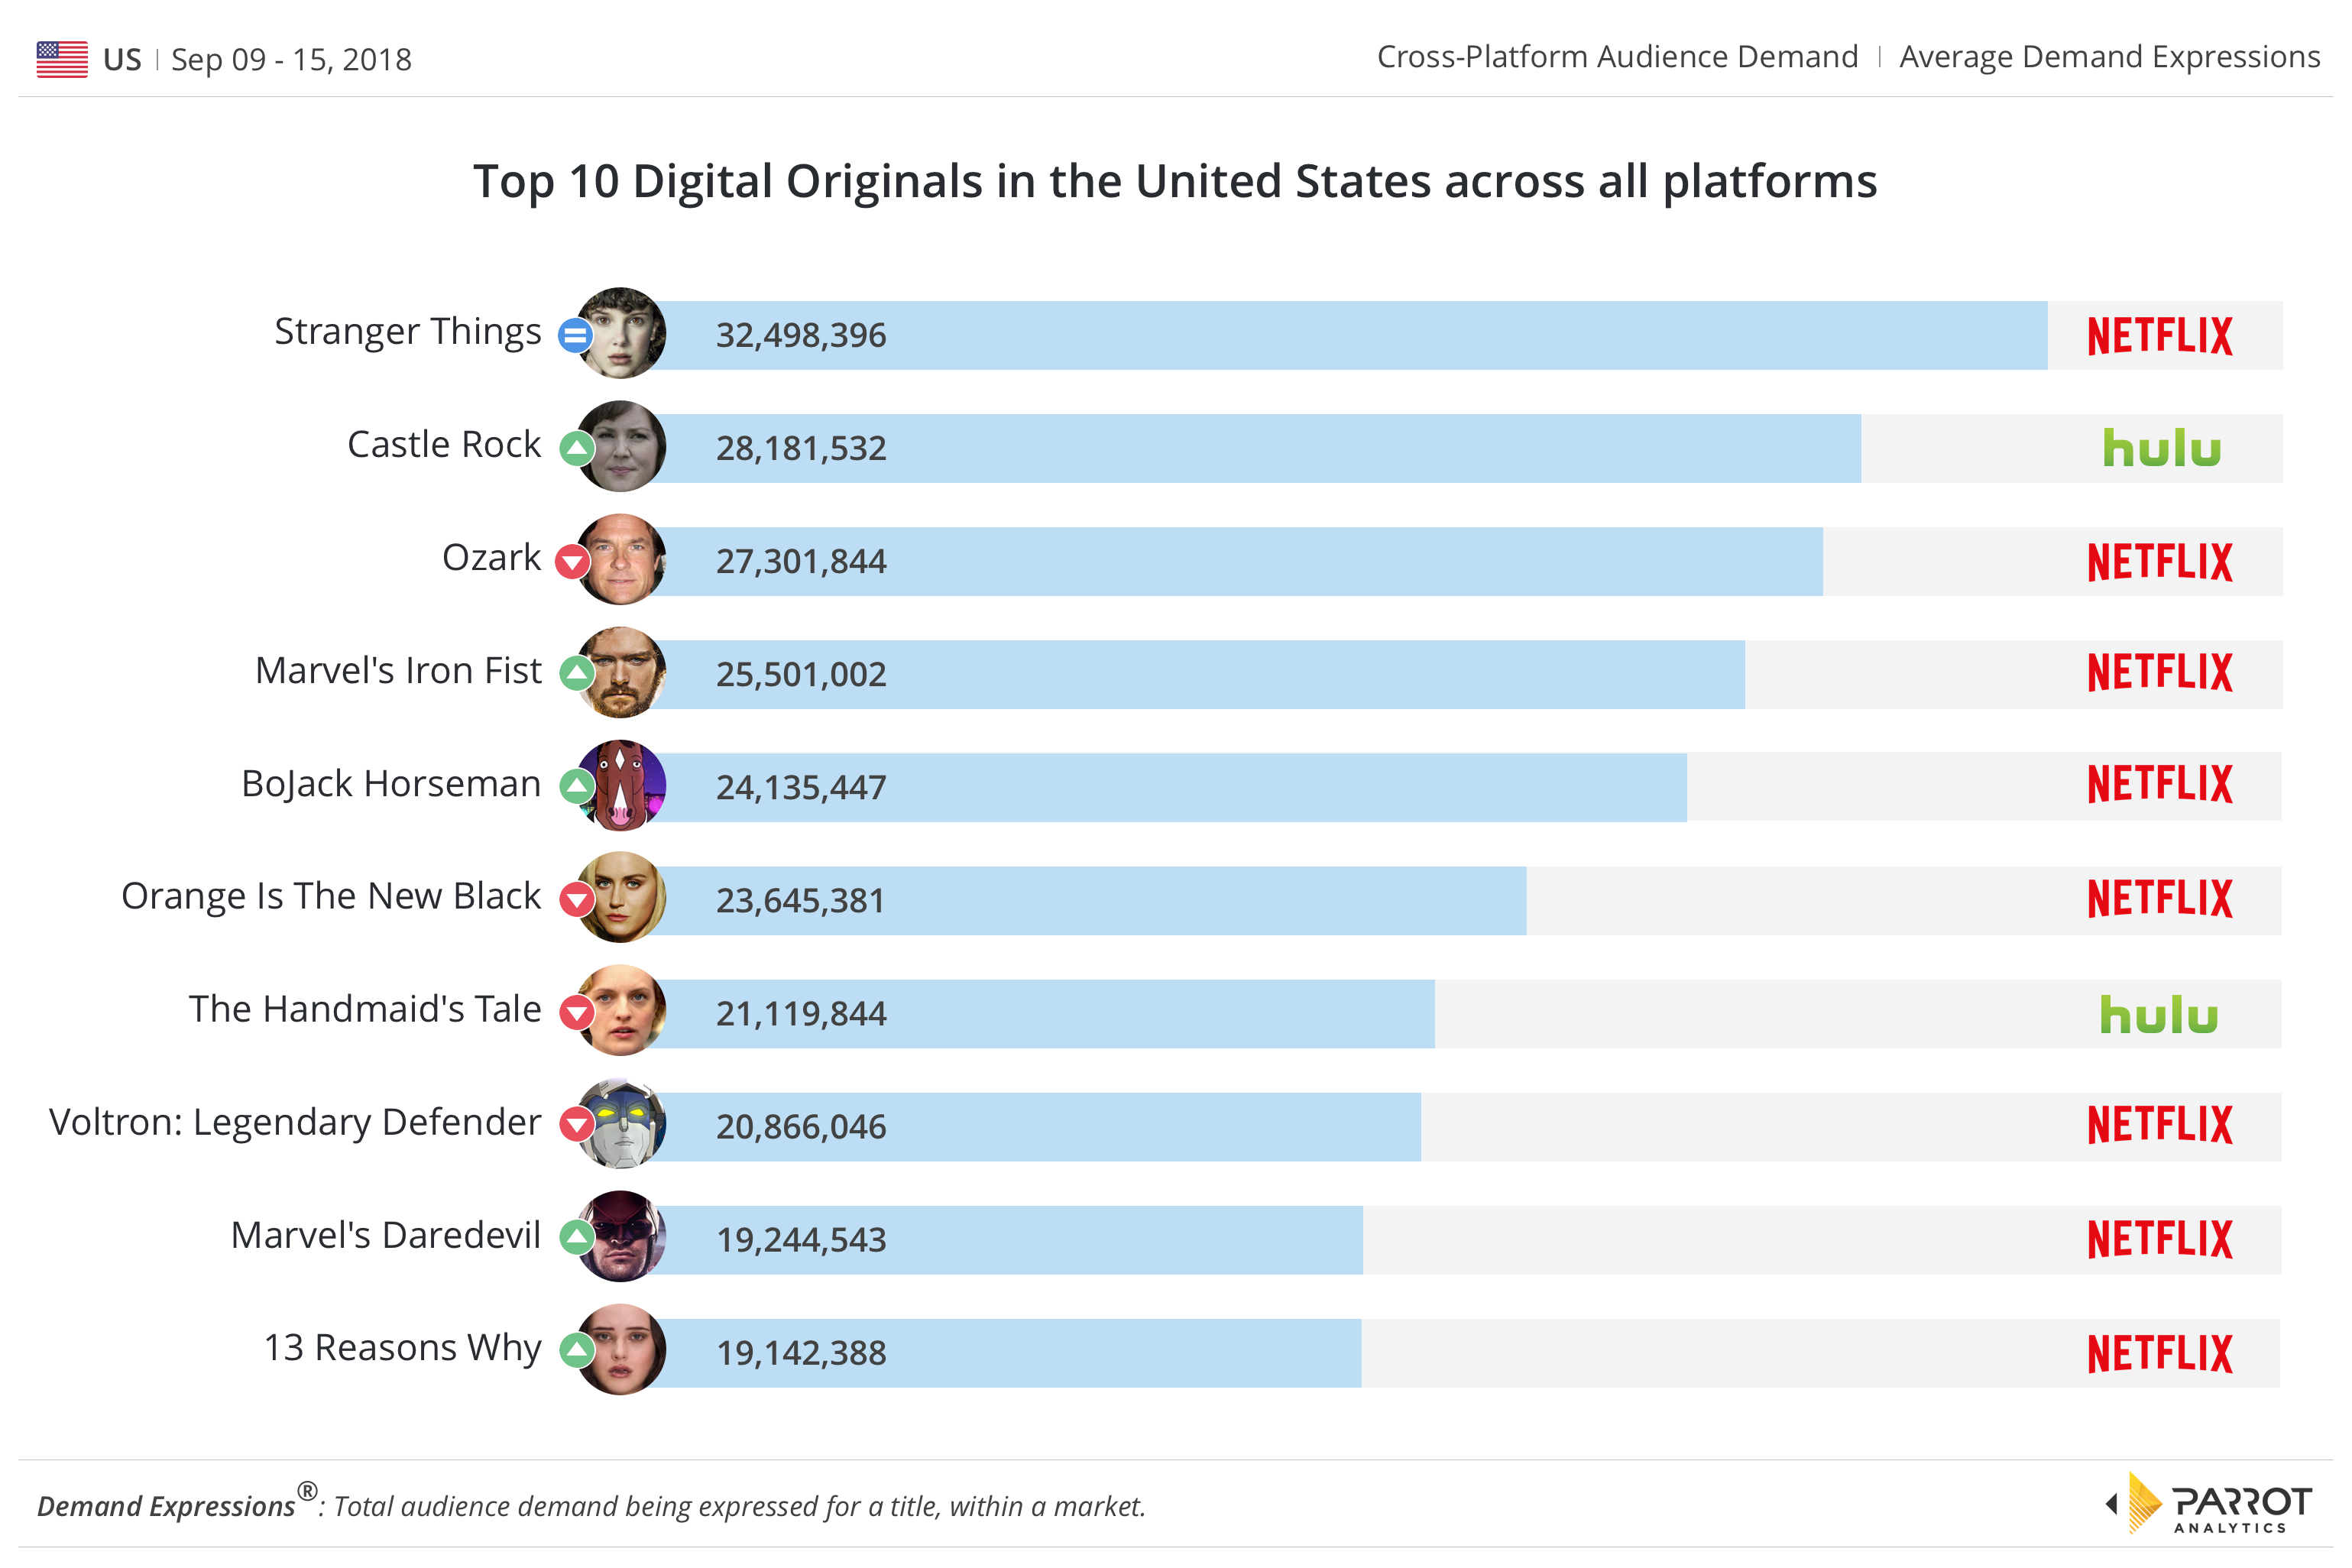
Beginning with the digital original chart, a pair of Marvel’s superhero series from Netflix have reappeared in our chart as we head into the fall season. The arrival of the hotly anticipated second season of Marvel’s Iron Fist on September 7th meant the action series had no trouble staying in the top 5 of the U.S. digital originals chart this week, with more than a two-fold increase in weekly average demand compared to the prior week.
Our global TV demand data also reveals that the perennially popular Marvel’s Daredevil (ranked #9) experienced a 20% week-on-week increase on the back of a teaser trailer released on September 11th. A demand uptick for Marvel/Netflix titles tends to happen around the summer release of significant Marvel motion picture releases; the previous “Avengers universe” film was released in April.
Finales and premieres also impacted on title rankings this week: After a successful season launch, Hulu’s Castle Rock ended on September 12th. High demand for this event caused it to rise to be the second most in-demand show in the U.S., up two places compared to last week. Meanwhile, BoJack Horseman increased in demand 24% week-on-week after new episodes started airing on September 14th.
Looking now at the overall chart we observe gradual gains for many titles as we head into the fall premiere season yet there are also many titles that have stayed much the same: FX’s American Horror Story, Cartoon Network’s Adventure Time, HBO’s Game of Thrones and CW’s The Flash all stayed in the same position in the chart compared to last week.
In the bottom two, fan engagement is keeping demand for ABC’s Grey’s Anatomy and Showtime’s Shameless high: The medical drama series does not premiere until the 27th while Shameless earned its place to be the longest-running original scripted series in Showtime’s history – and still going strong.
For more information, reach out to Parrot Analytics for a live demonstration of our Demand Portal, or watch our latest product video.
The data in this article are based on Demand Expressions (DEX). DEX is the globally standardized TV measurement metric developed by Parrot Analytics, which represents the total audience demand being expressed for a title, within a market. Audience demand reflects the desire, engagement and viewership, weighted by importance; so a stream/download is a higher expression of demand than a ‘like’/comment.


