The Streaming Wars are here to stay and in this post we are presenting a data-centric model to understand what it takes to win.
First, we break down the TV streamer business model into key levers that drive subscriber growth and retention. Then, we demonstrate the value of Parrot Analytics’ global TV demand dataset as a leading indicator for key financial and operational metrics. By quantifying the relationship between consumer demand for content and these key metrics, Parrot Analytics helps investors assess and predict business value.
Deconstructing retention and acquisitions: Key financial & operational metrics
The diagram below represents the mechanics of how the SVOD business model attracts Net Adds to its platform in any market:
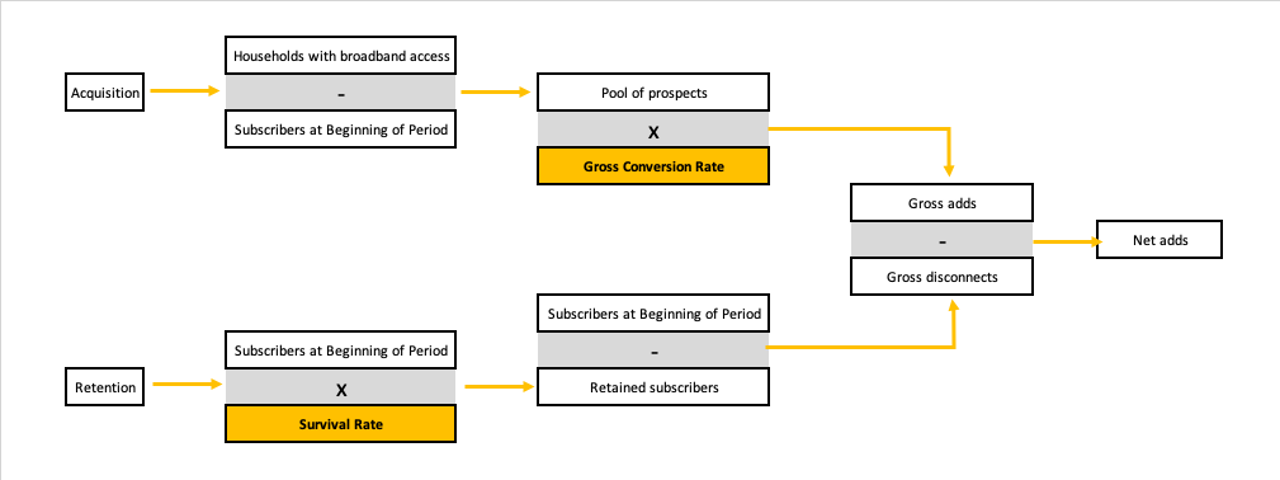
In this model two key levers drive growth and retention:
- Gross Conversion Rate: The probability that someone who is not currently a subscriber will sign up to the service.
- Survival Rate: The percentage of subscribers that stay with the service after each period of measurement.
Introducing content demand: Quantifying the market share for consumer attention
At Parrot Analytics, we start from the premise that consumer attention is limited by time. We quantify this attention by capturing how consumers express demand for content, for each title in each market.
Every day our platform collects over 1 Billion demand expressions which represent a wide spectrum of audience behavior including video streaming, social media, blogging platforms, file sharing, and peer-to-peer consumption spanning 100+ countries. This, the world’s largest TV audience demand dataset, combined with our artificial intelligence platform, allows Parrot Analytics to provide unprecedented insights into market-specific demand for content.
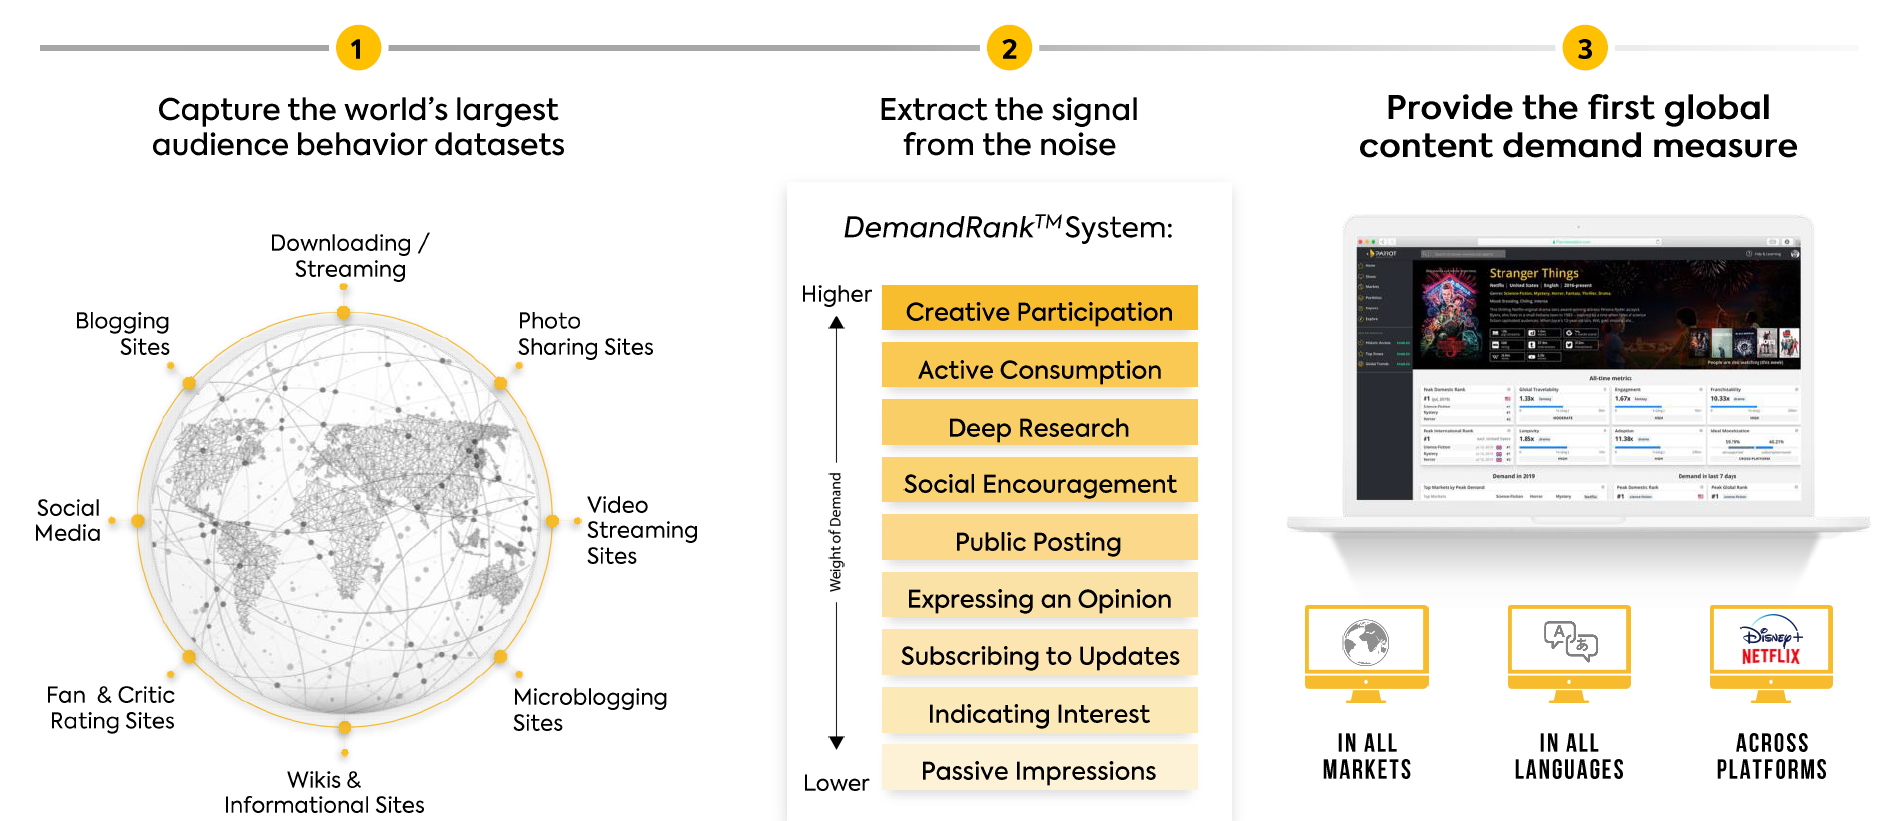
For example, in the US we currently track the daily audience demand of the catalogs of content from 75 direct-to-consumer platforms that make over twenty thousand TV shows available to subscribers. By comparing the demand that each title attracts vis-a-vis the aggregate demand for all titles in a market, we quantify the Market Share of Attention for any individual title, or on an aggregated basis, for a platform as a whole.
This patented system of data collection and quantification delivers a unique market perspective, resulting in providing the industry with the key leading indicator – attention market share – that is useful to understand and predict Gross Conversion Rate, Survival Rate, and other key metrics for any SVOD platform.
The correlation model: Netflix’s share of consumer attention vs key financial and operational metrics
Using Netflix as an example, we construct a correlation model to compare Key Domestic Performance and Operational Metrics against Market Share of Attention captured by individual titles that were available on their US catalog during the 7 quarters through 3Q 2019.
Examining correlations between attention leading indicators and business performance metrics, the below heat map serves as a starting point to find relationships that help investors evaluate business value.
We note that the Pearson’s correlation index measures how any two variables move together: A value of 1 (red) indicates a perfect positive relationship where both variables move together, -1 (blue) indicates a perfect inverse relationship where both variables move opposite to one another, and values near 0 mean there is no correlation between the variables.
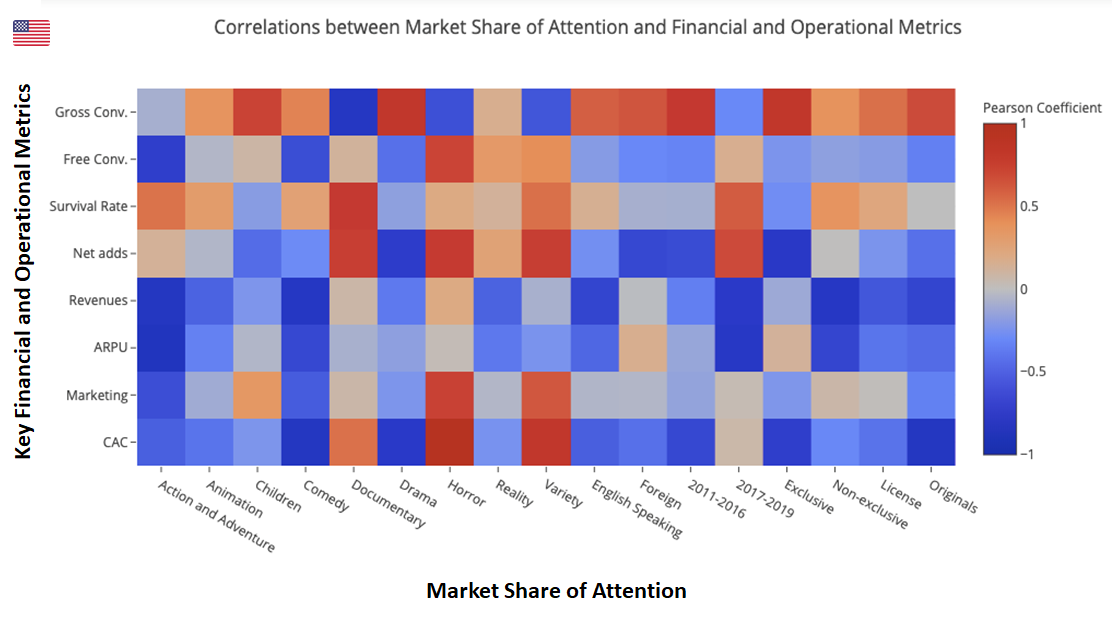
Source: Visible Alpha and Parrot Analytics [1]
The following sections will dive deeper into the data underlying the relationship between these attention leading indicators and the financial and operational metrics over time.
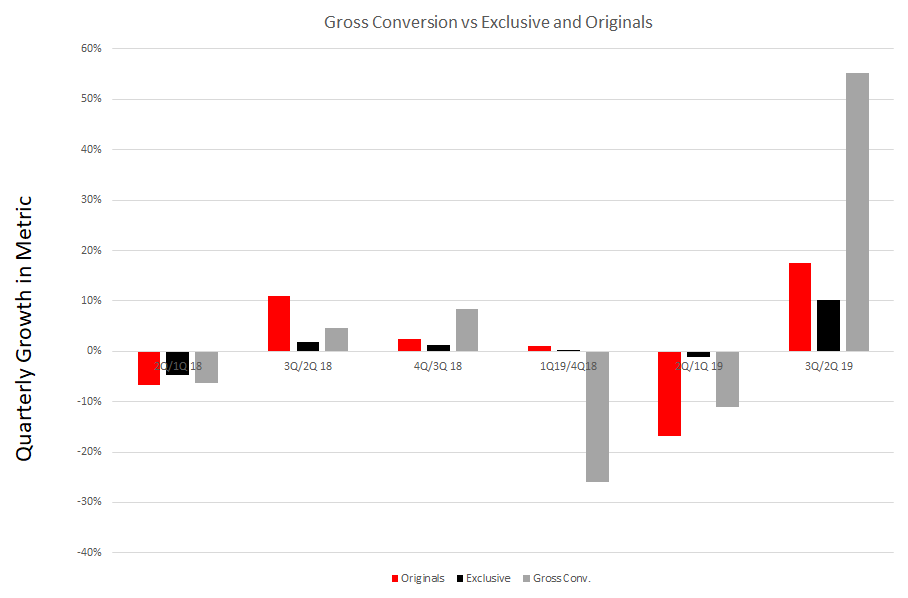
Correlations with gross conversions rate
As expected, the market share of Netflix Original content relative to all other original content owned by all other platforms correlates highly (>0.70) with the Gross Conversion Rate. We’ve previously demonstrated a positive relationship between demand for Netflix’s original content and its share price.
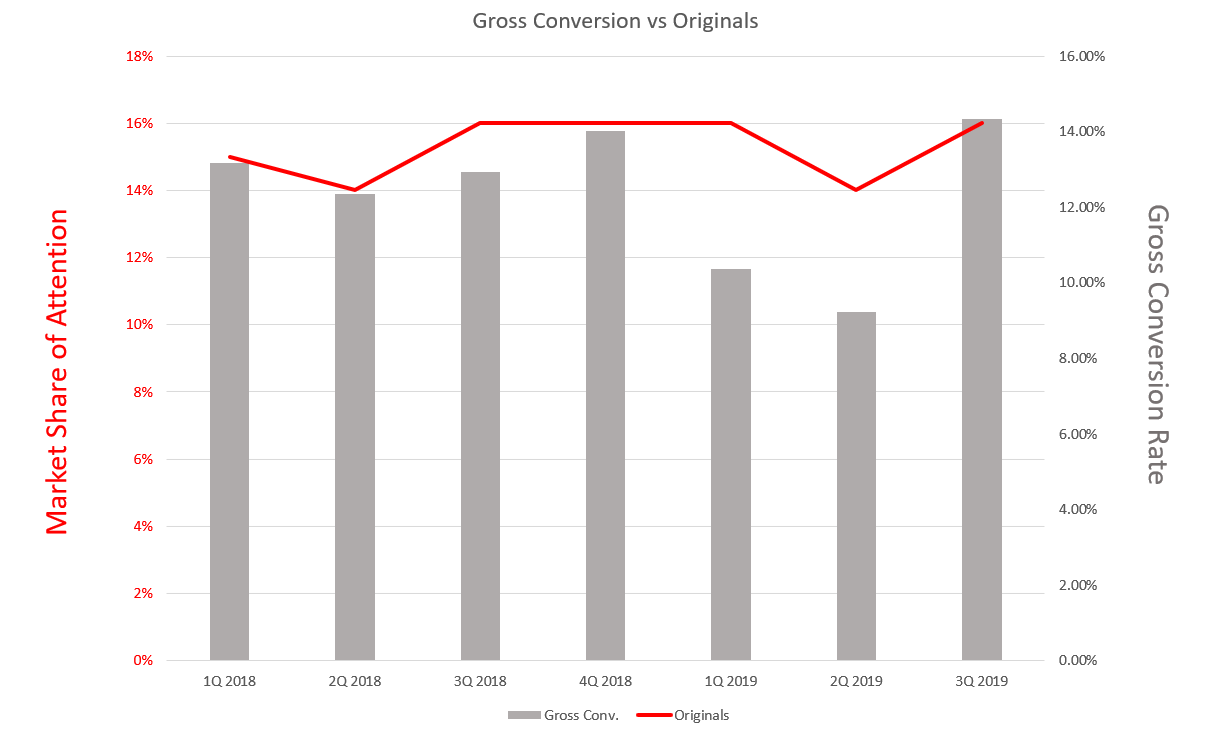
Gross Conversion Rate is also highly correlated with the market share of exclusive content, either original or licensed, that Netflix made available on its US catalog. In fact, exclusive content has an even greater correlation with the Gross Conversion Rate than just original content.
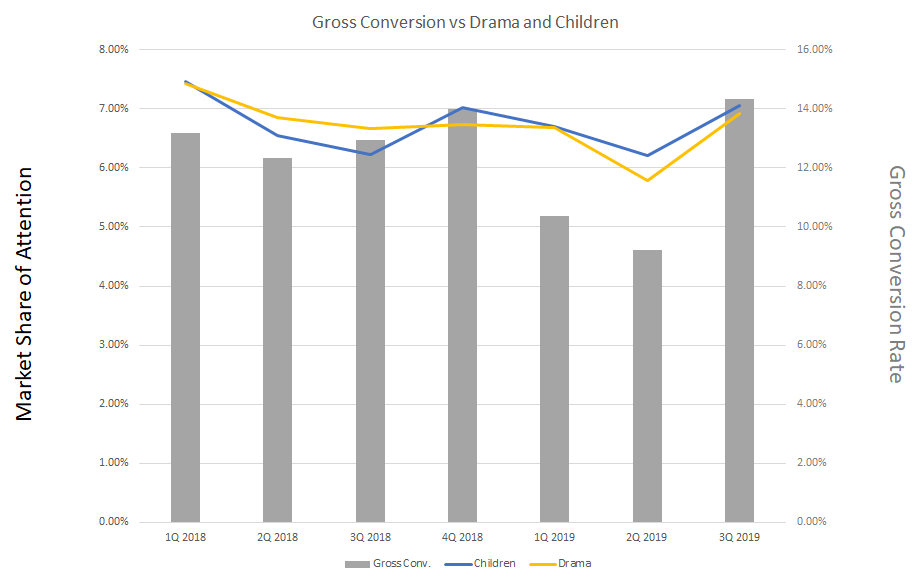
Additionally, high correlations with the Gross Conversion Rate were also found for the market share of attention in two specific genres: Drama, and to a lesser degree Children. This suggests that maintaining and growing leadership in these main genres is important to keep adding subscribers. Developing a library of Children’s content has additional strategic benefits, not the least of which is the relatively churn-proof nature of its diminutive fans.
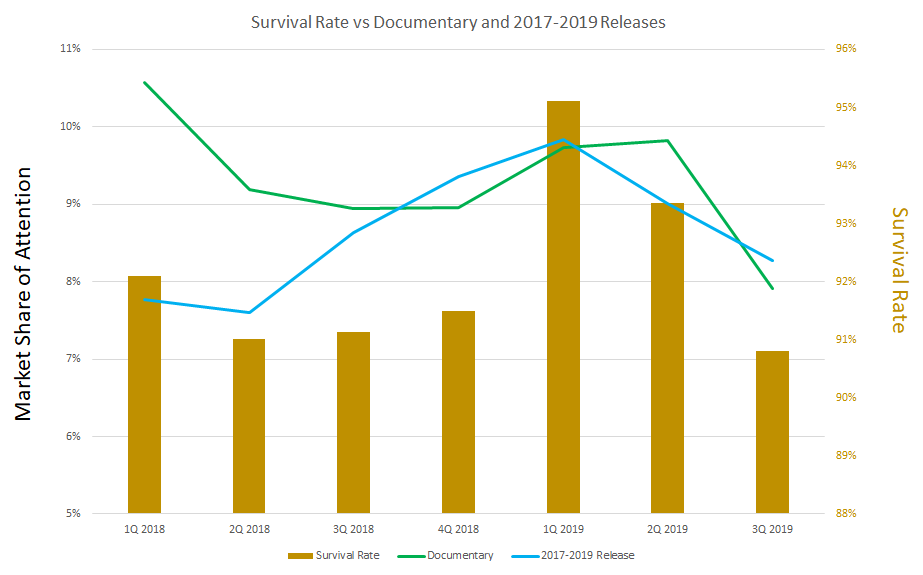
Correlations with survival rate
The market share of attention that Netflix received for both its documentaries and its freshly released new series (released for the first time no earlier than 2017) show high correlation with survival rates. To keep subscribers, Netflix needs to stay relevant with its new releases and provide documentaries on contemporary topics that entice subscribers to stay:
Correlations with other metrics that impact gross margin
Apart from correlating attention leading indicators with Gross Conversion and Survival Rate, correlations with other key financial and operational metrics uncover other findings to investigate further. We have detailed two of these below.
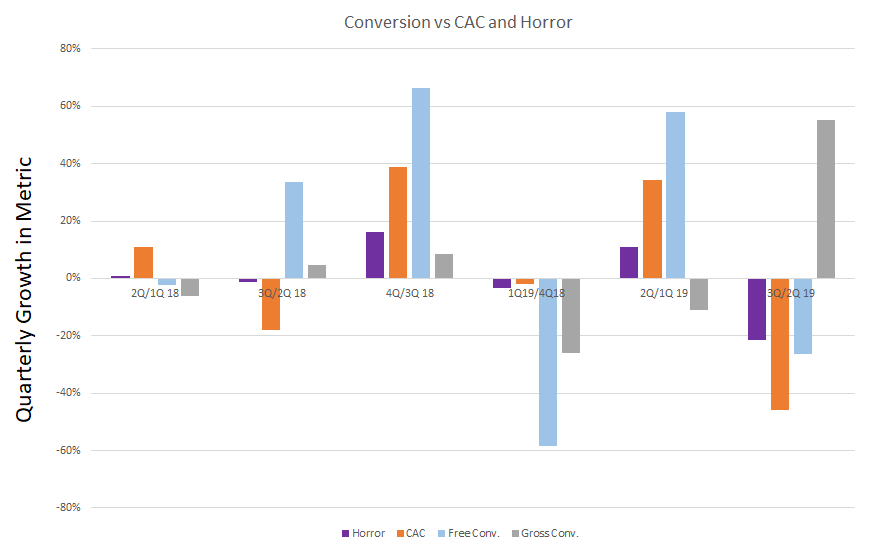
Horror releases: Not as effective – or a delayed effect?
Correlations imply that Horror releases drive up customer acquisition cost (CAC) and deliver higher conversion for free subscribers that do not ultimately convert as paid subscribers within the same period. It may be, however, that those free subscriptions do convert but during subsequent periods.
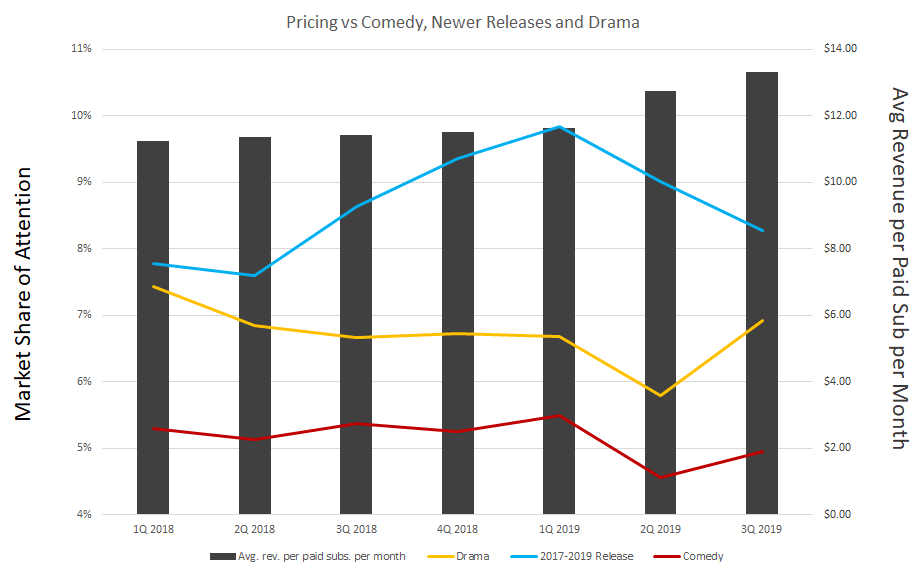
Price elasticity: Does this change depending on the content offering?
Correlations also suggest that recent price hikes are diminishing the attention that Comedy as well as newer releases are able to grab. However, Drama has not been as affected. This implies that price elasticity depends on the content offering.
Why is this relevant?
In the US, content available exclusively on Netflix has attracted the largest share of attention, as shown in red below:
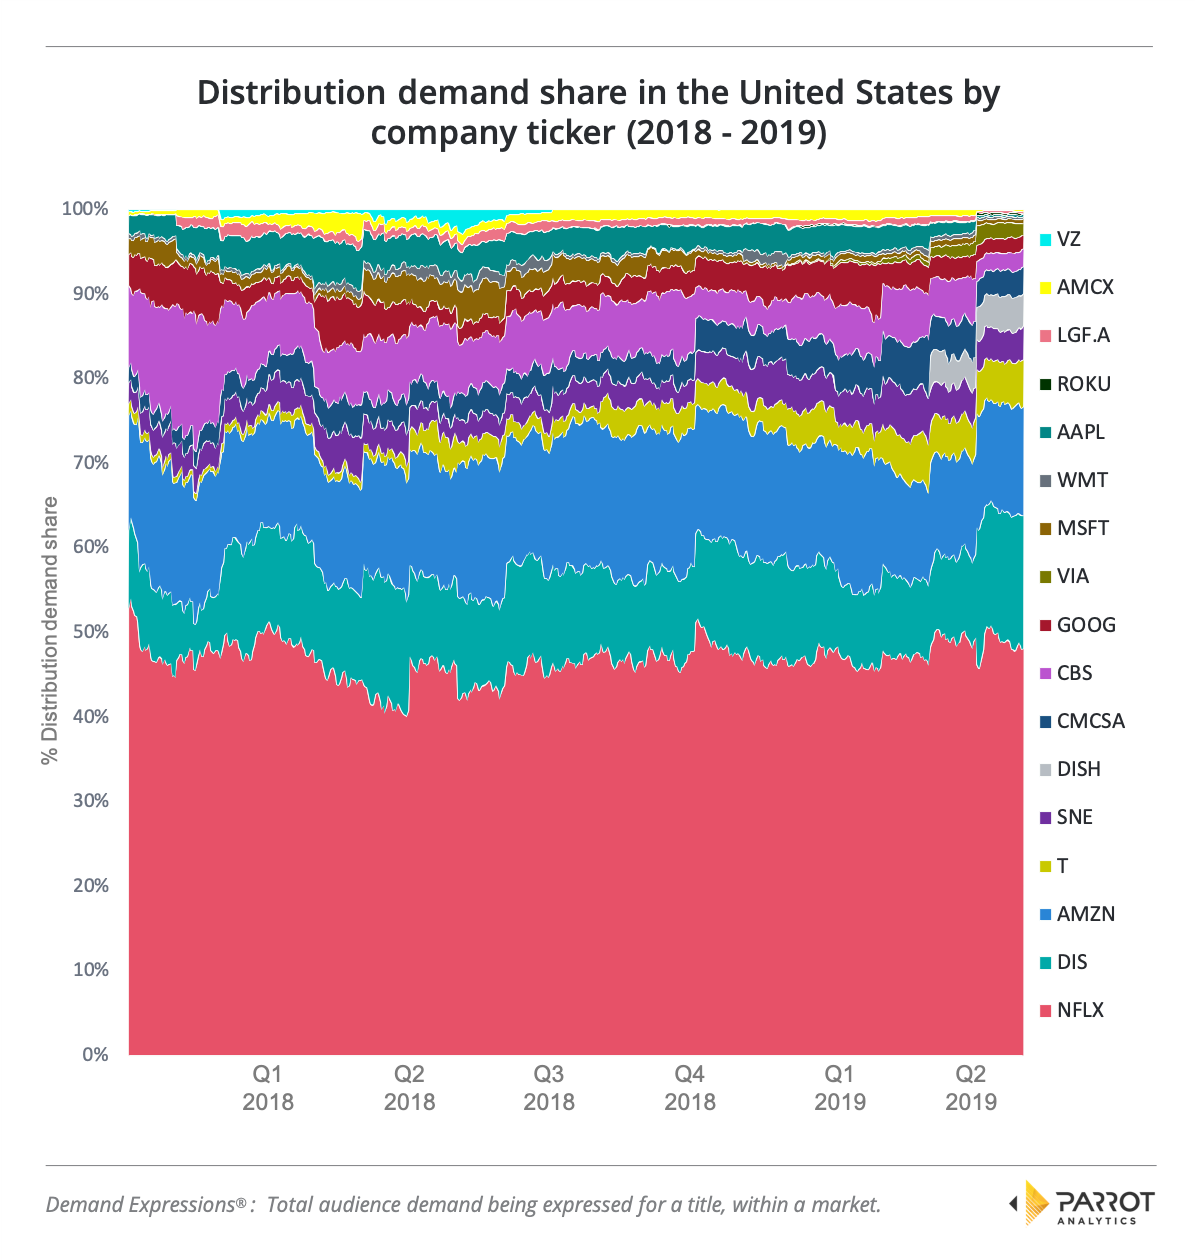
However, all major content IP owners including Disney, AT&T (WarnerMedia and HBO) and Comcast/NBCU (Peacock) already have, or are all launching, their own direct to consumer (DTC) platforms in the coming weeks and months. All of them are also pulling their content from Netflix.
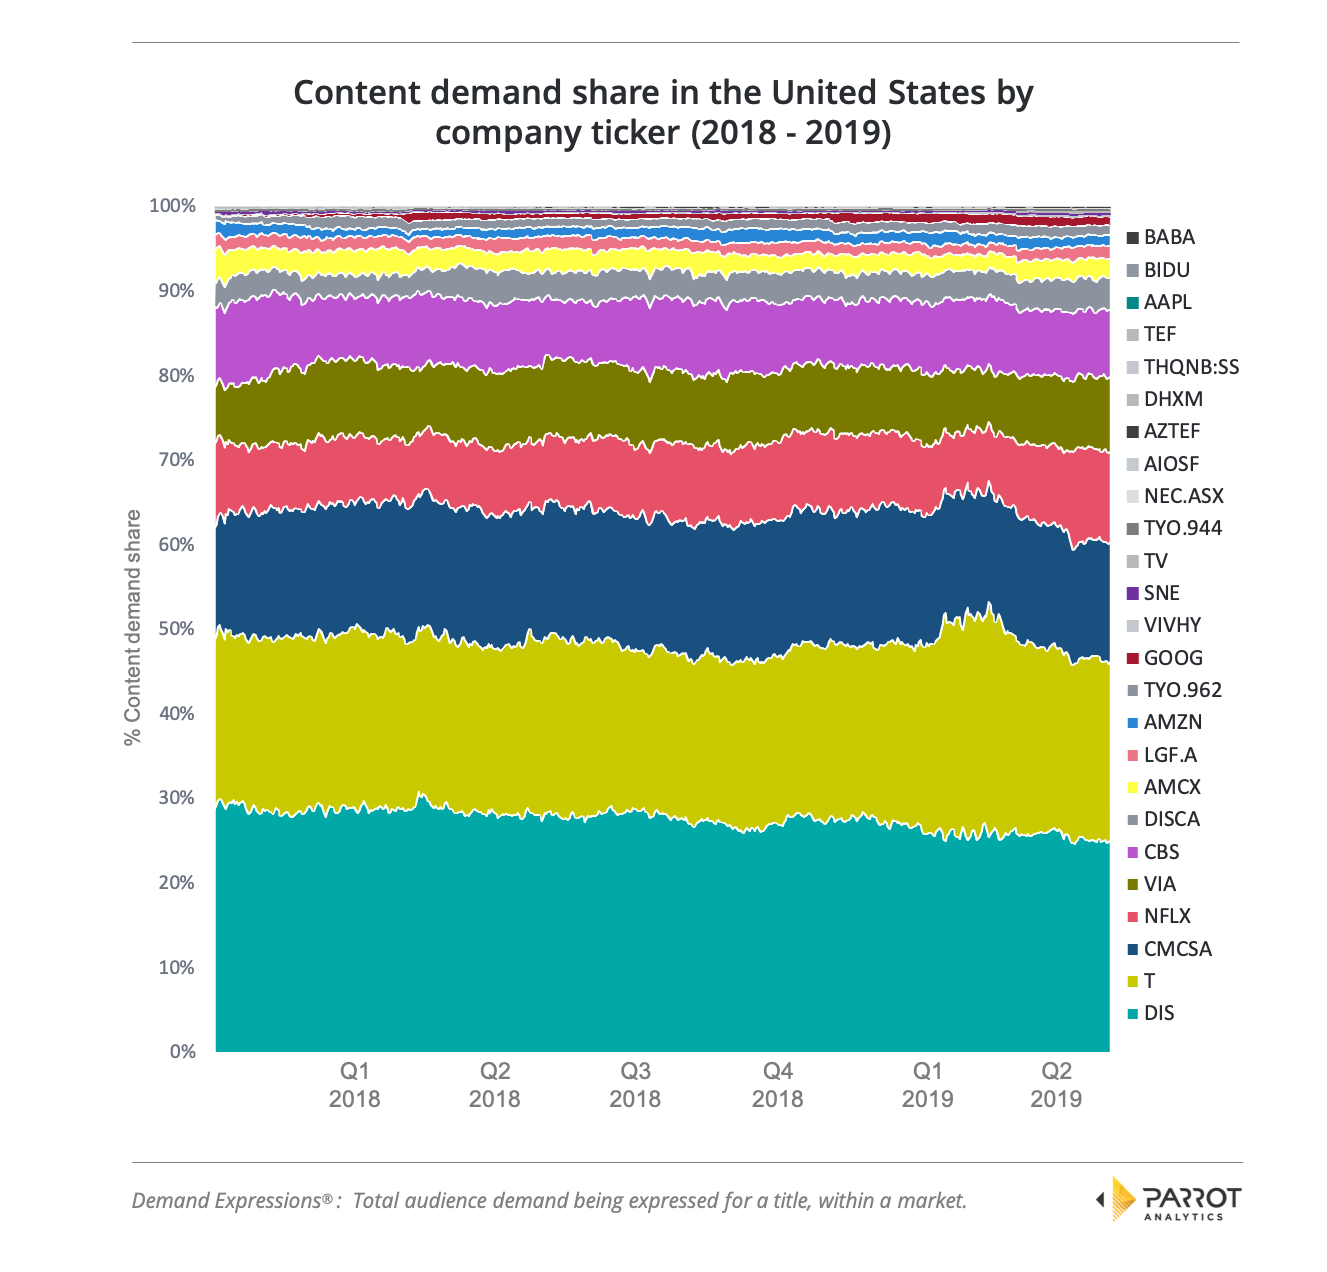
Consider a scenario where no licensing of content exists – the market share of attention for content on DTC platforms would look entirely different. The share of attention captured by content originally owned by these companies actually dwarfs the attention attracted by Netflix originals as shown below in teal (Disney), yellow (AT&T) and dark blue (Comcast/NBCU):
Deconstructing the business model of TV streamers into specific key acquisition and retention levers uncovers correlations with leading attention indicators that are collected and processed daily by Parrot Analytics.
By leveraging Parrot Analytics’ unique TV audience dataset, investors gain insights about the TV streaming sector that benefit both fundamental and quantitative strategies. Seeing how attention is split among all SVOD content offerings leads to a better understanding and prediction of key financial and operational metrics; this understanding derived from global TV demand data allows OTT platforms to drive subscriptions and business value, increasing each company’s level of competitiveness in a sector ripe for a massive transfer of value.
On a final note, make sure you also read Parrot Analytics’ other articles in our OTT strategy series, for example, a demand-driven pathway for OTT platforms to create sustainable growth.
Acknowledgements
At Parrot Analytics, we want to thank Visible Alpha for consolidating key operational and financial indicators that were used to construct the presented analysis.

