Image: The Man in the High Castle, Amazon Video
Late last week, Reuters released extracts from an internal Amazon document that detailed some aspects of the performance of the Prime Video business. As well as giving a new estimate for the number of US Amazon Prime subscribers that use Prime Video – 26 million as of early 2017 – Reuters goes into detail about Amazon’s goals for the five billion USD that they claim Amazon spends on content yearly.
Essentially, the entertainment arm of the online shopping behemoth is an elaborate acquisition strategy to entice people to become Prime members, a goal which is bluntly summed up in this 2016 Jeff Bezos quote: “When we win a Golden Globe, it helps us sell more shoes”. The rationale behind this goal is straightforward; Bezos has stated in the past that Prime members buy more from Amazon than non-Prime members.
As such, it is not a surprise then that the company has expanded its focus from producing sophisticated, award-winning shows such as Transparent towards trying to find a mass-market blockbuster in the vein of HBO’s Game Of Thrones. In fact, the document seen by Reuters contains a tidbit about their most likely contender so far as it reveals that the Amazon Lord Of The Rings series is expected to cost half a billion USD for two seasons.
Amazon’s “Cost Per First Stream” metric, contextualized with Parrot Analytics demand data
Reuters also outlines Amazon’s “Cost Per First Stream” metric. This internal metric is highly focused on Amazon’s goal of generating new Prime members. The way it works is to take the first season of a show that a new Prime member streams, as that user’s “First Stream”. The cost of producing and marketing that season is then divided by the number of First Streams to get the Cost Per First Stream, with a lower cost being better.
In their article, Reuters provided details of this metric for a selection of seasons for Amazon Original titles, which we have plotted against the average demand for that season. The average demand is taken over the airing period for an episodic release series such as The Grand Tour; for shows where Amazon released the entire season at once, we took the demand average for a 30-day period from the release date. Please note: This does mean that demand is excluded for pilot episodes that aired in advance of the main release, as was Amazon practice for many of these titles.
The following chart allows us to contextualize Amazon’s “Cost Per First Stream” (CPFS) against each series’ audience demand, revealing clusters of shows that we have loosely grouped as follows:
- Subscription Drivers: High audience demand, low CPFS
- Churn Reducers: High audience demand, high CPFS
- Niche Attractors: Low audience demand, low CPFS
- Low ROI Shows: Low audience demand, high CPFS
The dashed lines indicate the averages for all eight seasons analyzed.
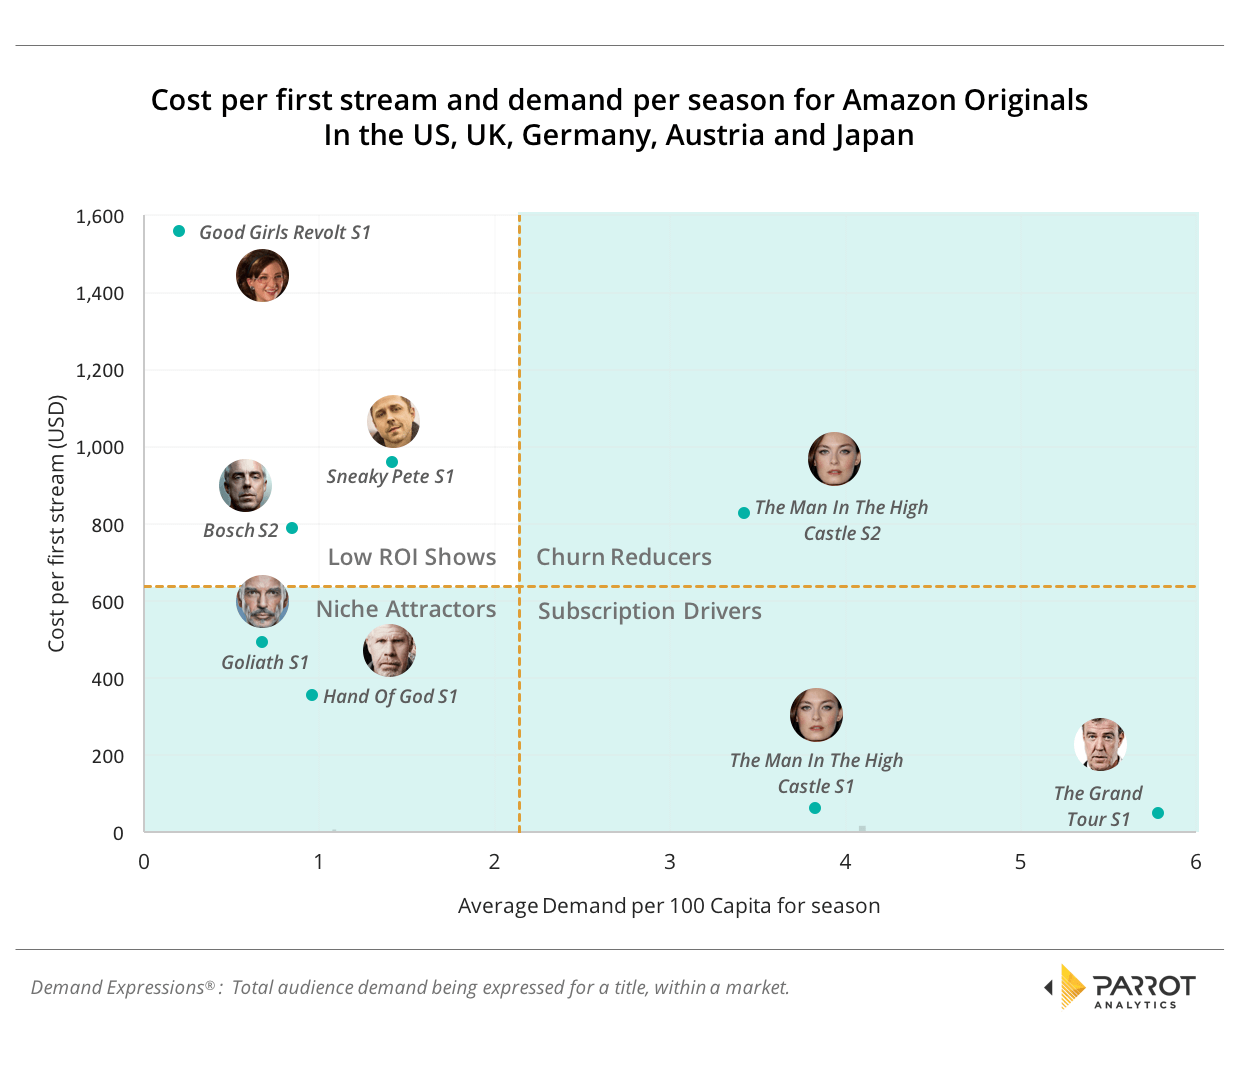
In this chart, the bottom right quadrant represents “Subscription Drivers”. This quadrant is Amazon’s ideal: The shows here have a below average cost per first stream and above average demand and so are expected to be bringing in large numbers of new subscribers at a high acquisition ROI. The Grand Tour season 1 and The Man In The High Castle season 1 were the two titles in the sample that were highly successful as judged by both metrics.
The top right quadrant represents the shows that can perhaps be called “Churn Reducers”. While these have above average demand, the shows here are either not attracting significant amounts of new subscribers or they do so at a higher than average cost, overall offering a poorer ROI. These shows therefore appear to appeal more to existing subscribers that have already watched at least one other show. This category is extremely important to all streaming platforms, including Amazon. Given Amazon also has other consumer value drivers, just consider the various Prime benefits including free shipping, the overall consumer value proposition is compelling. This no doubt serves the company well to retain its customers and keep them locked into the annual Prime membership.
The bottom left quadrant represents “Niche Attractors”. These shows have below average demand, but the viewers these series are attracting are assumed to be new to the platform, and are being acquired at a higher than average ROI. Shows here are going to be judged on which niche they are attracting; those that bring in a valuable demographic are going to be looked upon favorably for renewing.
Finally, the top left quadrant contains shows with low demand and an above average cost-per-first stream. These shows are less popular than the other shows, and the viewers they do have are assumed to be not new to Amazon. Consequently, these shows likely offer a poorer ROI for the platform and probably should not be continued: In fact, Good Girls Revolt – the furthest show from the average and so the worst performing – has already been cancelled.
Both Sneaky Pete and Bosch on the other hand are much closer to the average. These shows must be performing well on other metrics as Sneaky Pete received a second season, while Bosch has just been renewed for a fifth season. Indeed, Bosch is a cornerstone of Amazon’s scripted programming – there is therefore no doubt that both of these are on Amazon’s list of shows the service will want to continue to support, despite the series’ cost per first stream. In Bosch’s case, we will need to assume that season 1 performed well, and was seen by the service as a subscription driver or churn reducer, with only the subsequent season 2 being pushed in to the low ROI quadrant.
Summary
Throughout this analysis we have used two metrics only to place shows in one of four quadrants. In drawing our conclusions, the following caveat applies: It would be very surprising indeed if cost per first stream was the only metric Amazon uses when it comes to allocating content spend. For a start, it’s not fair to sequels: The Man In The High Castle season 2 has only slightly less demand than season 1, but a much, much higher Cost Per First Stream. This makes complete sense as the majority of people are going to watch Season 1 of a show before Season 2, so the first season is the one that will likely get the First Stream credit.
By leveraging Parrot Analytics’ global demand data to provide the necessary context, this analysis has shed further light as to how OTT platforms (global, regional and local) need to be evaluating the success of their content and make the acquisition, cancellation and renewal decisions they need in order to succeed.

