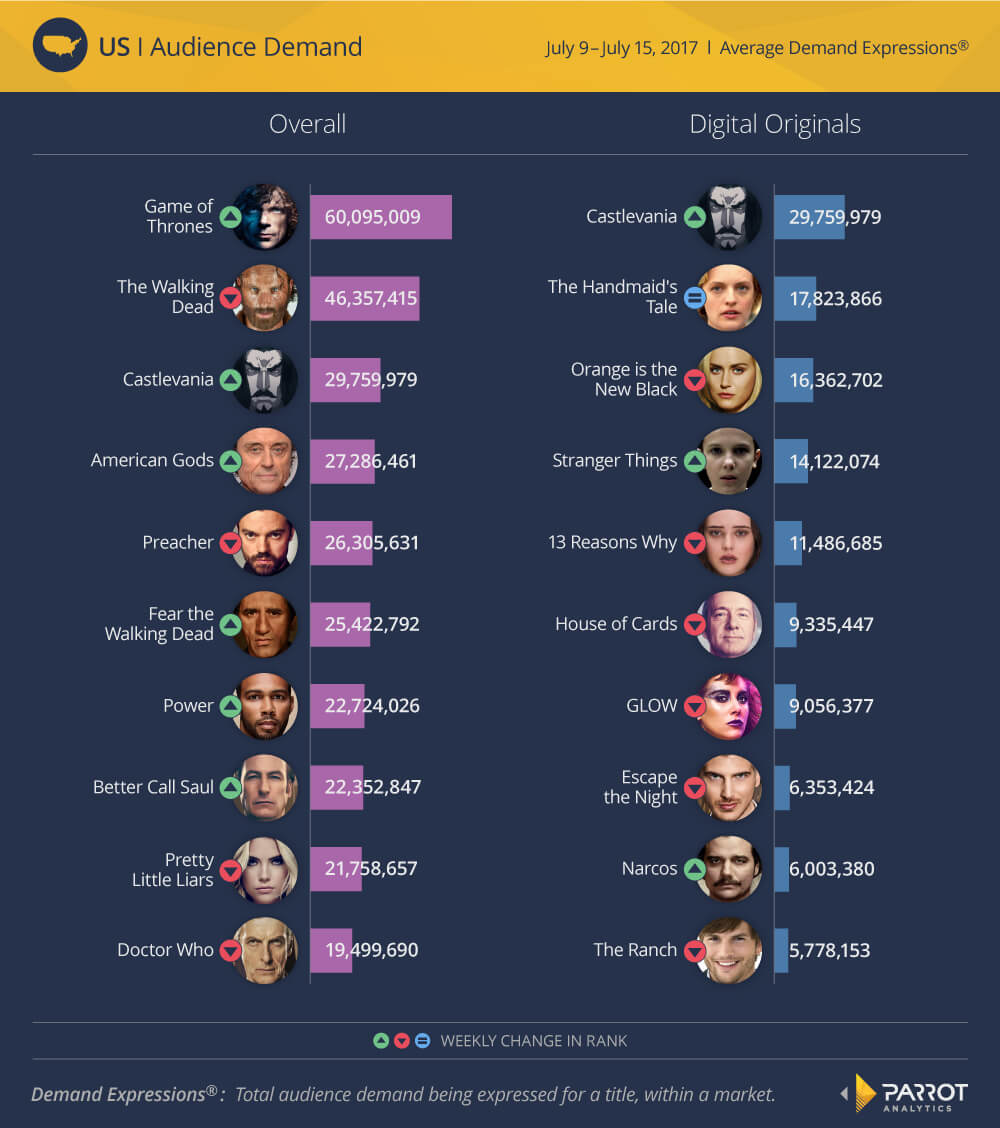
Parrot Analytics’ global demand measurement system is able to gauge the popularity of TV series viewed on connected TVs, anywhere in the world. Aside from tracking the country-specific demand of TV content on cable/broadcast, Parrot Analytics also tracks IPTV via its connected television measurement service. This week, Netflix’s Castlevania is capturing audiences’ attention; the anime series is now the most popular digital original series in the US. The animated series is produced in the US and features art style that is heavily influenced by Japanese anime. Castlevania is also ranked #3 on the overall series chart, generating approximately twice as much demand as The Handmaid’s Tale from Hulu last week. The demand for Hulu’s newest original drama actually gained 15% compared to last week, likely on the back of the show’s 13 nominations at the Emmy Awards 2017.
Per our connected television measurement service, older favourites such as Netflix’s Stranger Things and Narcos reappeared in the chart this week as new episodes return on October 27 and September 1, respectively.
In the overall series chart, the upcoming season of HBO’s Game of Thrones has seen the series gaining traction, ranking above AMC’s The Walking Dead by a wide margin; the fantasy series’ demand rose by 49% compared to last week. Elsewhere in the top ten, two new series have appeared this week: AMC’s Fear The Walking Dead was propelled to sixth position, after one of its two leads was “killed off” in a recent episode. As a result, the zombie drama series surpassed BBC’s Doctor Who by 30% in demand this week. Finally, Starz’s Power moved into seventh place after season four started airing on June 25.

