Image: The Handmaid’s Tale, Hulu
A television milestone was reached in September 2017 as Hulu’s The Handmaid’s Tale became the first digital original show to win the Best Drama Emmy. This historic first was repeated on January 7th this year when The Handmaid’s Tale won the Best Drama award at the Golden Globes, becoming the first digital original to win that award too.
Hulu had other reasons to celebrate, considering 2017 “a momentous year” – as a recent press release from the company called it. The same press release detailed Hulu’s advertising revenue growing over a billion dollars and the service’s viewership growing to over 54 million unique viewers.
Most importantly, the company released subscriber numbers for the first time since 2016, revealing that Hulu now has over 17 million subscribers. Parrot Analytics decided to see how these successes translated into demand for its content.
Did Hulu’s demand for original series grow with its subscriber base?
Hulu and other streaming services release their subscriber numbers infrequently. However, knowing the subscriber numbers in May 2016 and December 2017 for Hulu allow us to overlay these numbers with demand data for the service’s catalog of digital originals.
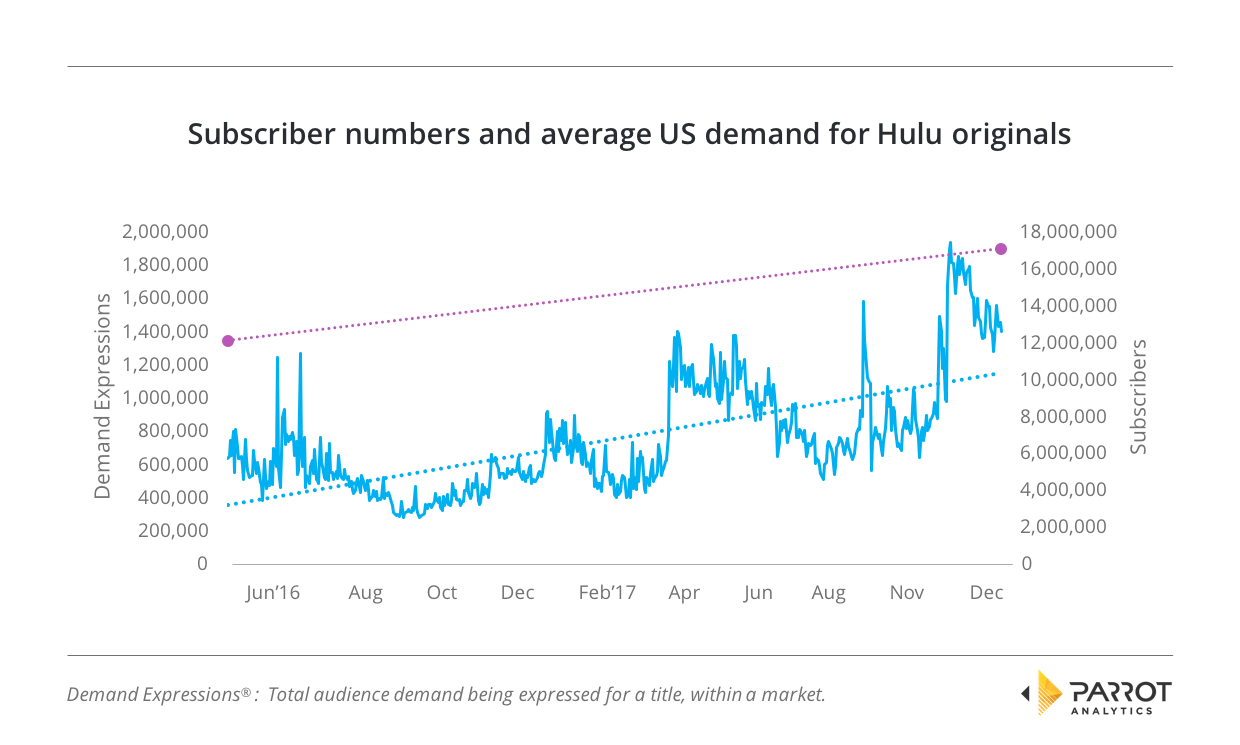
The previous statement released on Hulu’s subscriber numbers was for May 2016, when they reported 12 million subscribers. For the end of 2017, Hulu reported 17 million subscribers: this is a 41.6% growth over the 18 months.
We have added a linear trendline to visually show how the trend for demand has changed over this same period. It shows that the growth in demand for Hulu’s original series has greatly outpaced the growth in subscribers: Demand grew by 230%.
Some of this demand growth is easily attributable to individual titles; the release of The Handmaid’s Tale in May 2017 is accompanied by a large demand increase, while that show’s historic Emmy wins are the reason for the large demand spike in September 2017. And most recently, audiences have been expressing above-average demand for Marvel’s Runaways, the increase for which can be seen as 2017 ends.
It is reasonable to assume that there is a positive correlation between demand and subscriptions (and share price, as reported by Quartz) – if people want to watch your shows, they will sign up for your service – and so if Hulu can continue to increase demand for their originals, subscriber numbers will surely grow too.
Which shows on Hulu had the highest demand in 2017 in the US?
To dive deeper into the demand for Hulu’s originals, we now investigate which of Hulu’s original series had the highest average US demand in 2017.

This confirms The Handmaid’s Tale’s is the jewel in Hulu’s crown. The show has nearly three times the average demand of the next most in-demand show, The Path. The Path, in turn, has almost identical average demand to Marvel’s Runaways, a show which only debuted in late November of 2017.
The return of The Handmaid’s Tale in April is likely to ensure the show remains top of this list for the foreseeable future.
However, while of course there are people who subscribe for the Hulu originals, Hulu’s press release highlights the extensiveness of the service’s back catalog of titles: 75,000 episodes across 1,600 titles, which they note is double the numbers of Netflix and Amazon. As the catalogs of streaming services are constantly changing, which of Hulu’s current catalog titles have the most demand right now?
To investigate this further, we have analyzed a recent one-month dataset. Our findings reveal that Showtime’s Shameless is the biggest demand draw for Hulu, followed by Hulu’s own Marvel’s Runaways and the vintage British comedy Mr. Bean: a show Parrot Analytics has observed always does well around the holiday. The list tends towards comedies; of the top five, only Runaways is a drama title.
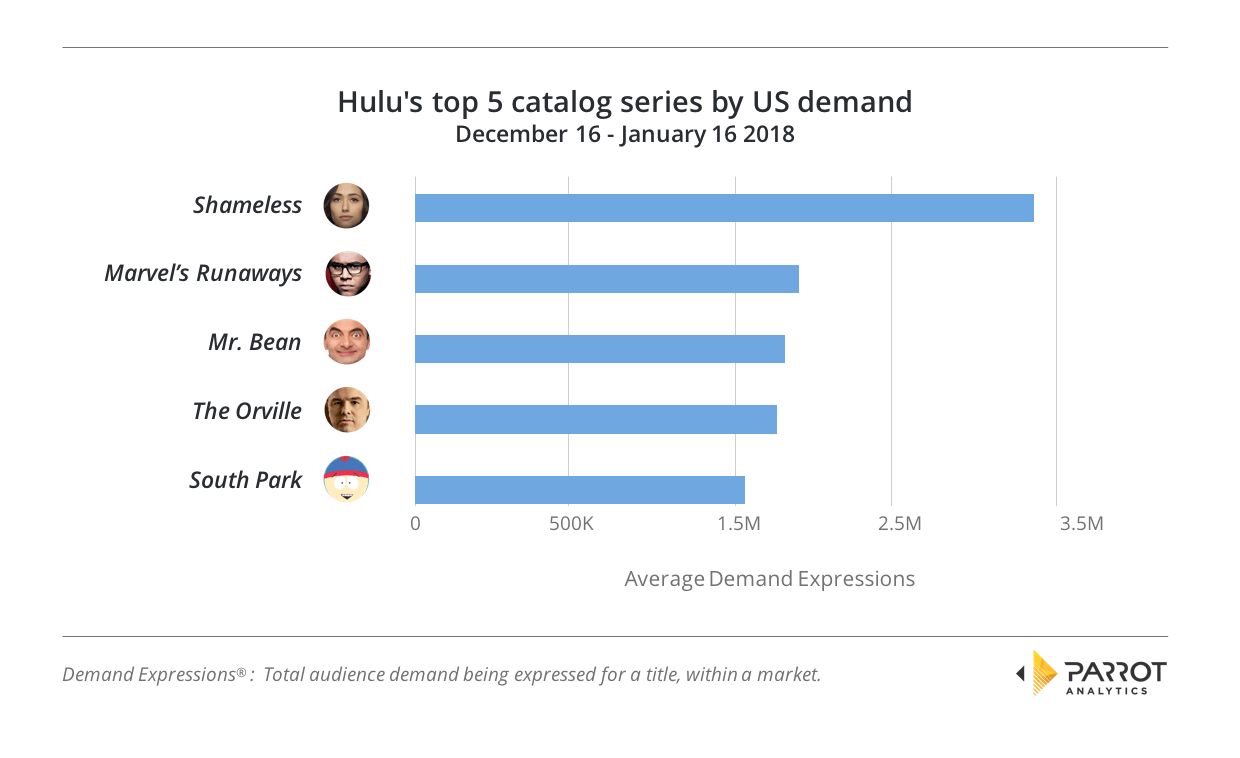
To ensure Hulu is not being attributed undue demand in this list, we have omitted all shows where Hulu does not hold the rights to the most recent season.
It must also be noted here that whilst demand data includes a viewership contribution, demand is not equivalent to views (as other factors such as social media, ratings and critic websites, fan blogs, etc are also incorporated and weighted into the overall demand figure). Further, while some shows are very easy to watch they do not lend themselves to engagement beyond that; yet other shows have a small but highly enthusiastic fanbase.
How does Hulu’s US performance compare to streaming rivals?
However, the true test is how these demand numbers compare to Hulu’s big streaming rivals in the US: Netflix and Amazon. By averaging the 2017 demand for all the original series produced by each service in the US, we can see which service’s originals are most popular with American audiences.
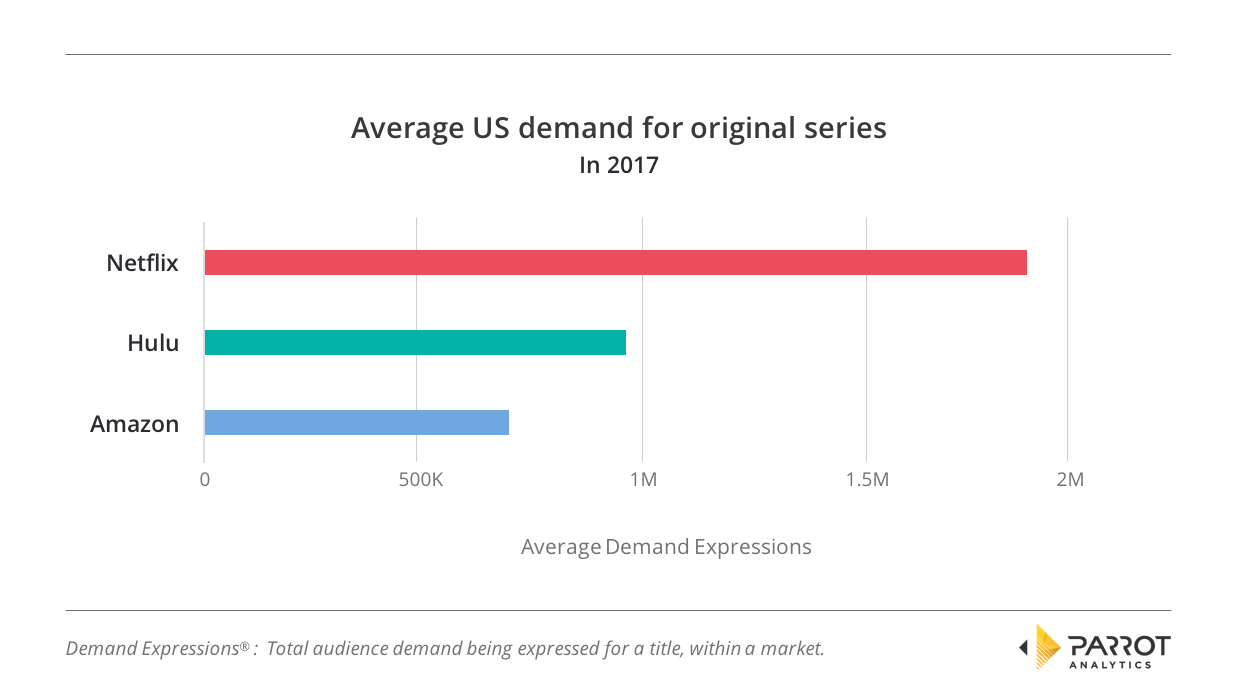
Netflix still has the highest average demand for its original series, with the average Hulu original having around half of the average Netflix demand. Amazon originals trail in third, the average original series from that service has 37% of Netflix’s average demand.
When the subscriber base of each service is considered, this becomes more impressive for Hulu: it has around half the average demand with around a third of the subscriber base compared to Netflix (the service most recently reported 54.8 million US subscribers for the fourth quarter of 2017). With these numbers considered, Hulu actually has around a 50% advantage in demand per subscriber over Netflix.
(Amazon only releases overall subscription numbers to its Prime service, and unfortunately, we have no information on what proportion of these subscribers use the SVOD part of Prime)
As previously noted, many subscribers for each service care more about the titles they can watch in each streamer’s overall catalog than about original series. We therefore also determine the average demand for a catalog title for Hulu, Netflix and Amazon. Please note, as before, that this analysis is for the current catalog for each and only for a month.
Additionally, to ensure that this analysis accurately measures the impact of a service’s most popular shows, only the top 20% of titles by demand for each service are included in the average.
This reveals a far closer result: The average demand for the 20% most popular catalog titles on each service is a near tie between Netflix and Hulu, there is only a 1% difference between the two. Meanwhile, Amazon trails with approximately a third of the average demand of the other streamers.
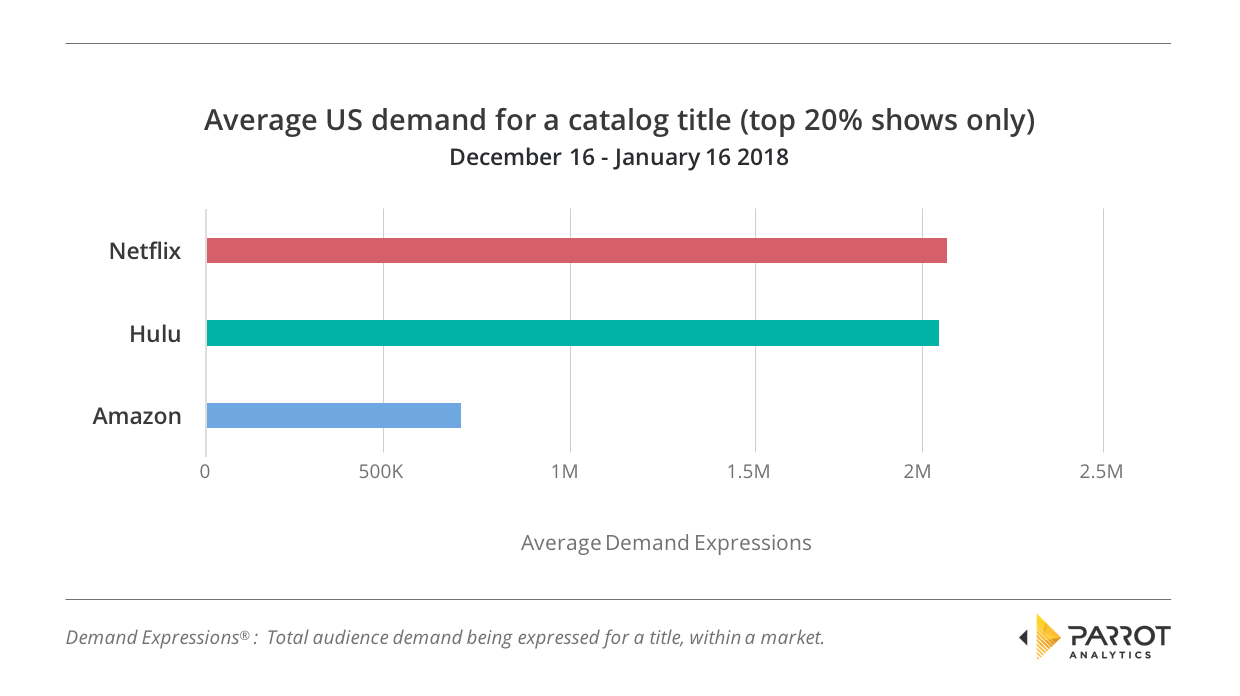
This is a very interesting result: If a potential new subscriber was choosing between the Hulu and Netflix catalogs by demand average, then both are the same quality (if we allow ourselves to take the above findings as a proxy for quality). However, Hulu has twice the number of catalog titles at this average – and so twice the quantity at this quality.
Given these results, it is likely that the battle between Hulu and Netflix will continue to intensify over the course of 2018; and no doubt Amazon will be doing everything it can to close the gap.
Note: Elements of this analysis were first published in the New York Observer.

