Image: Chilling Adventures Of Sabrina, Netflix
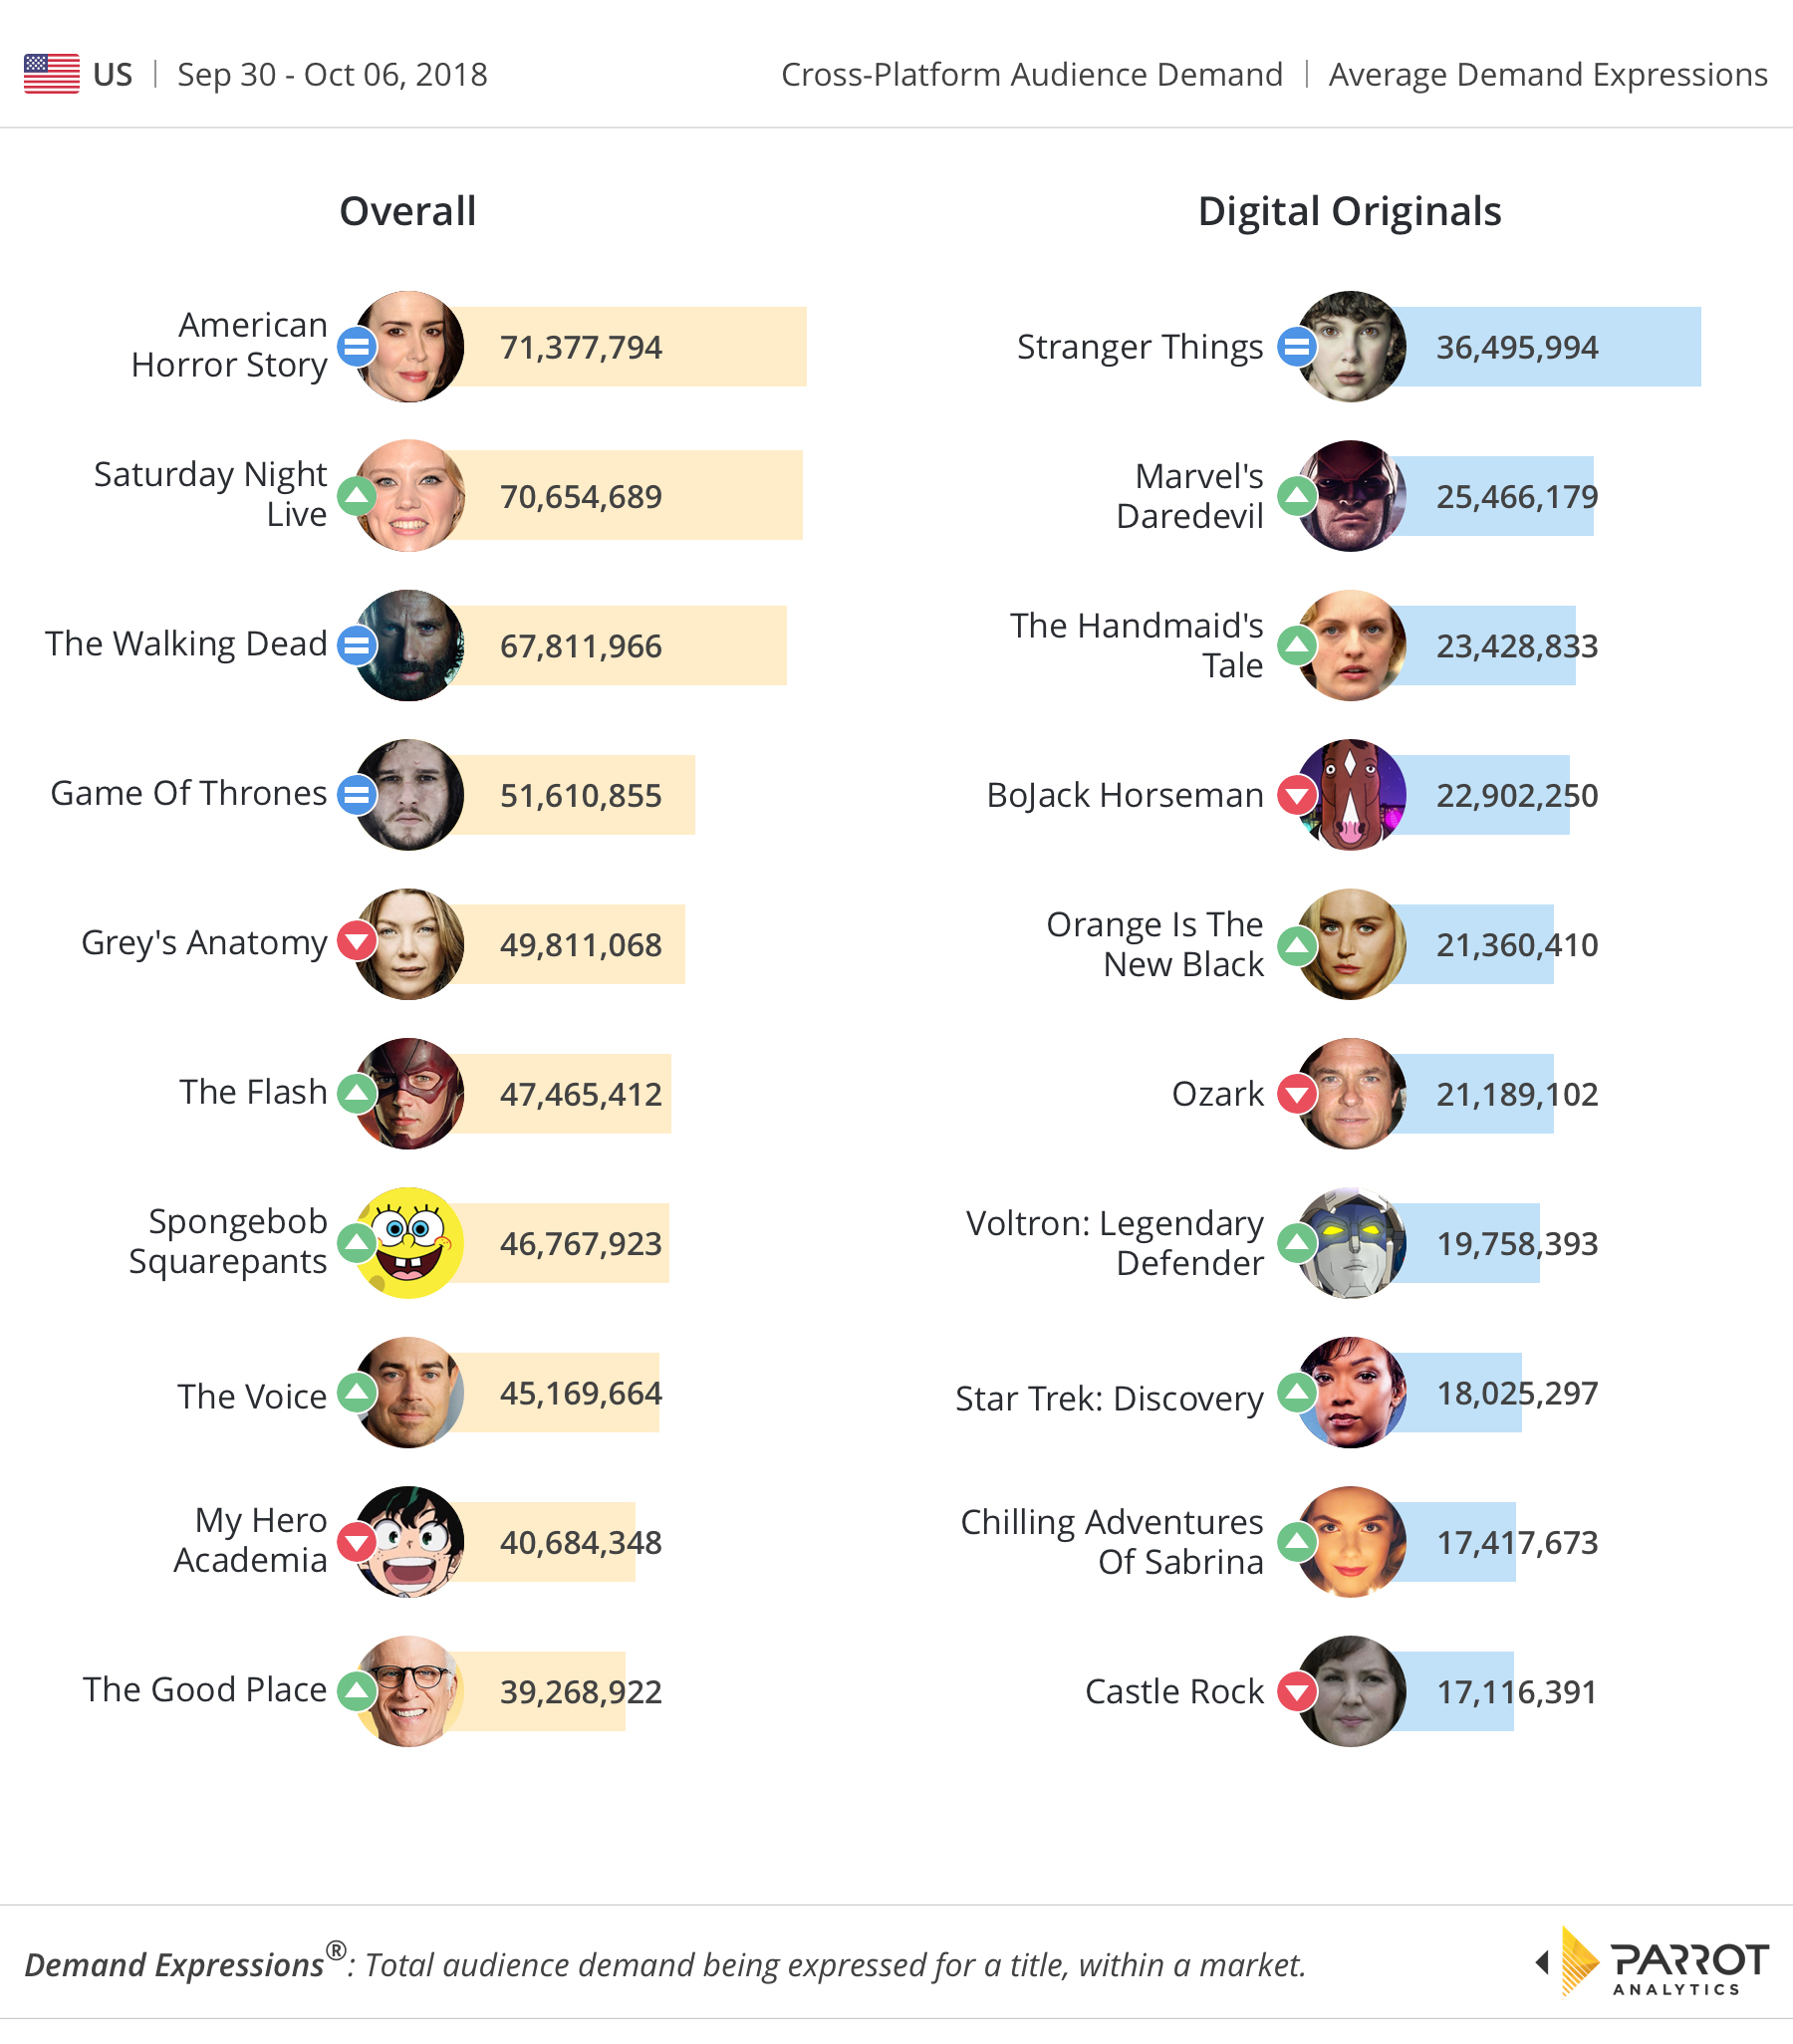
Parrot Analytics’ demand measurement platform provides insights into global, real-time, country-specific audience demand for television content. Our global OTT data measurement standard, capturing cross-platform demand based on our Demand Expressions metric, corresponds to the total audience demand being expressed for a title, within a market regardless of platform: Audience demand reflects the desire, engagement, and viewership of content consumers, weighted by importance; so a stream/download is a higher expression of demand than a ‘like’/comment. As usual, let us now take a look at the U.S. domestic numbers for streaming digital originals and overall TV shows, across all platforms in the U.S.
A new entry in the week ending October 6th in the digital original measurement chart is Netflix’s Chilling Adventures Of Sabrina (with a five-fold increase of demand compared to the previous week) entering in ninth’s place. The Roberto Aguirre-Sacasa created supernatural series does not premiere until October 26th, but interest in the show is already strong after its surprise trailer at NY Comic Con. The series is a darker take on the characters and setting of Sabrina the Teenage Witch and shared the same creator of the CW series Riverdale.
Netflix’s Stranger Things (-5% compared to the previous week) has continued to stay at No.1 for three consecutive weeks in our digital originals chart. Fan engagement is also keeping demand for Marvel’s Daredevil high: The show has moved from No. 6 to No. 2 in the wake of fan excitement over the full trailer released for season 3 on October 4th. Season three of Marvel’s Daredevil (+10% compared to the prior week) will debut exclusively on Netflix on October 19th.
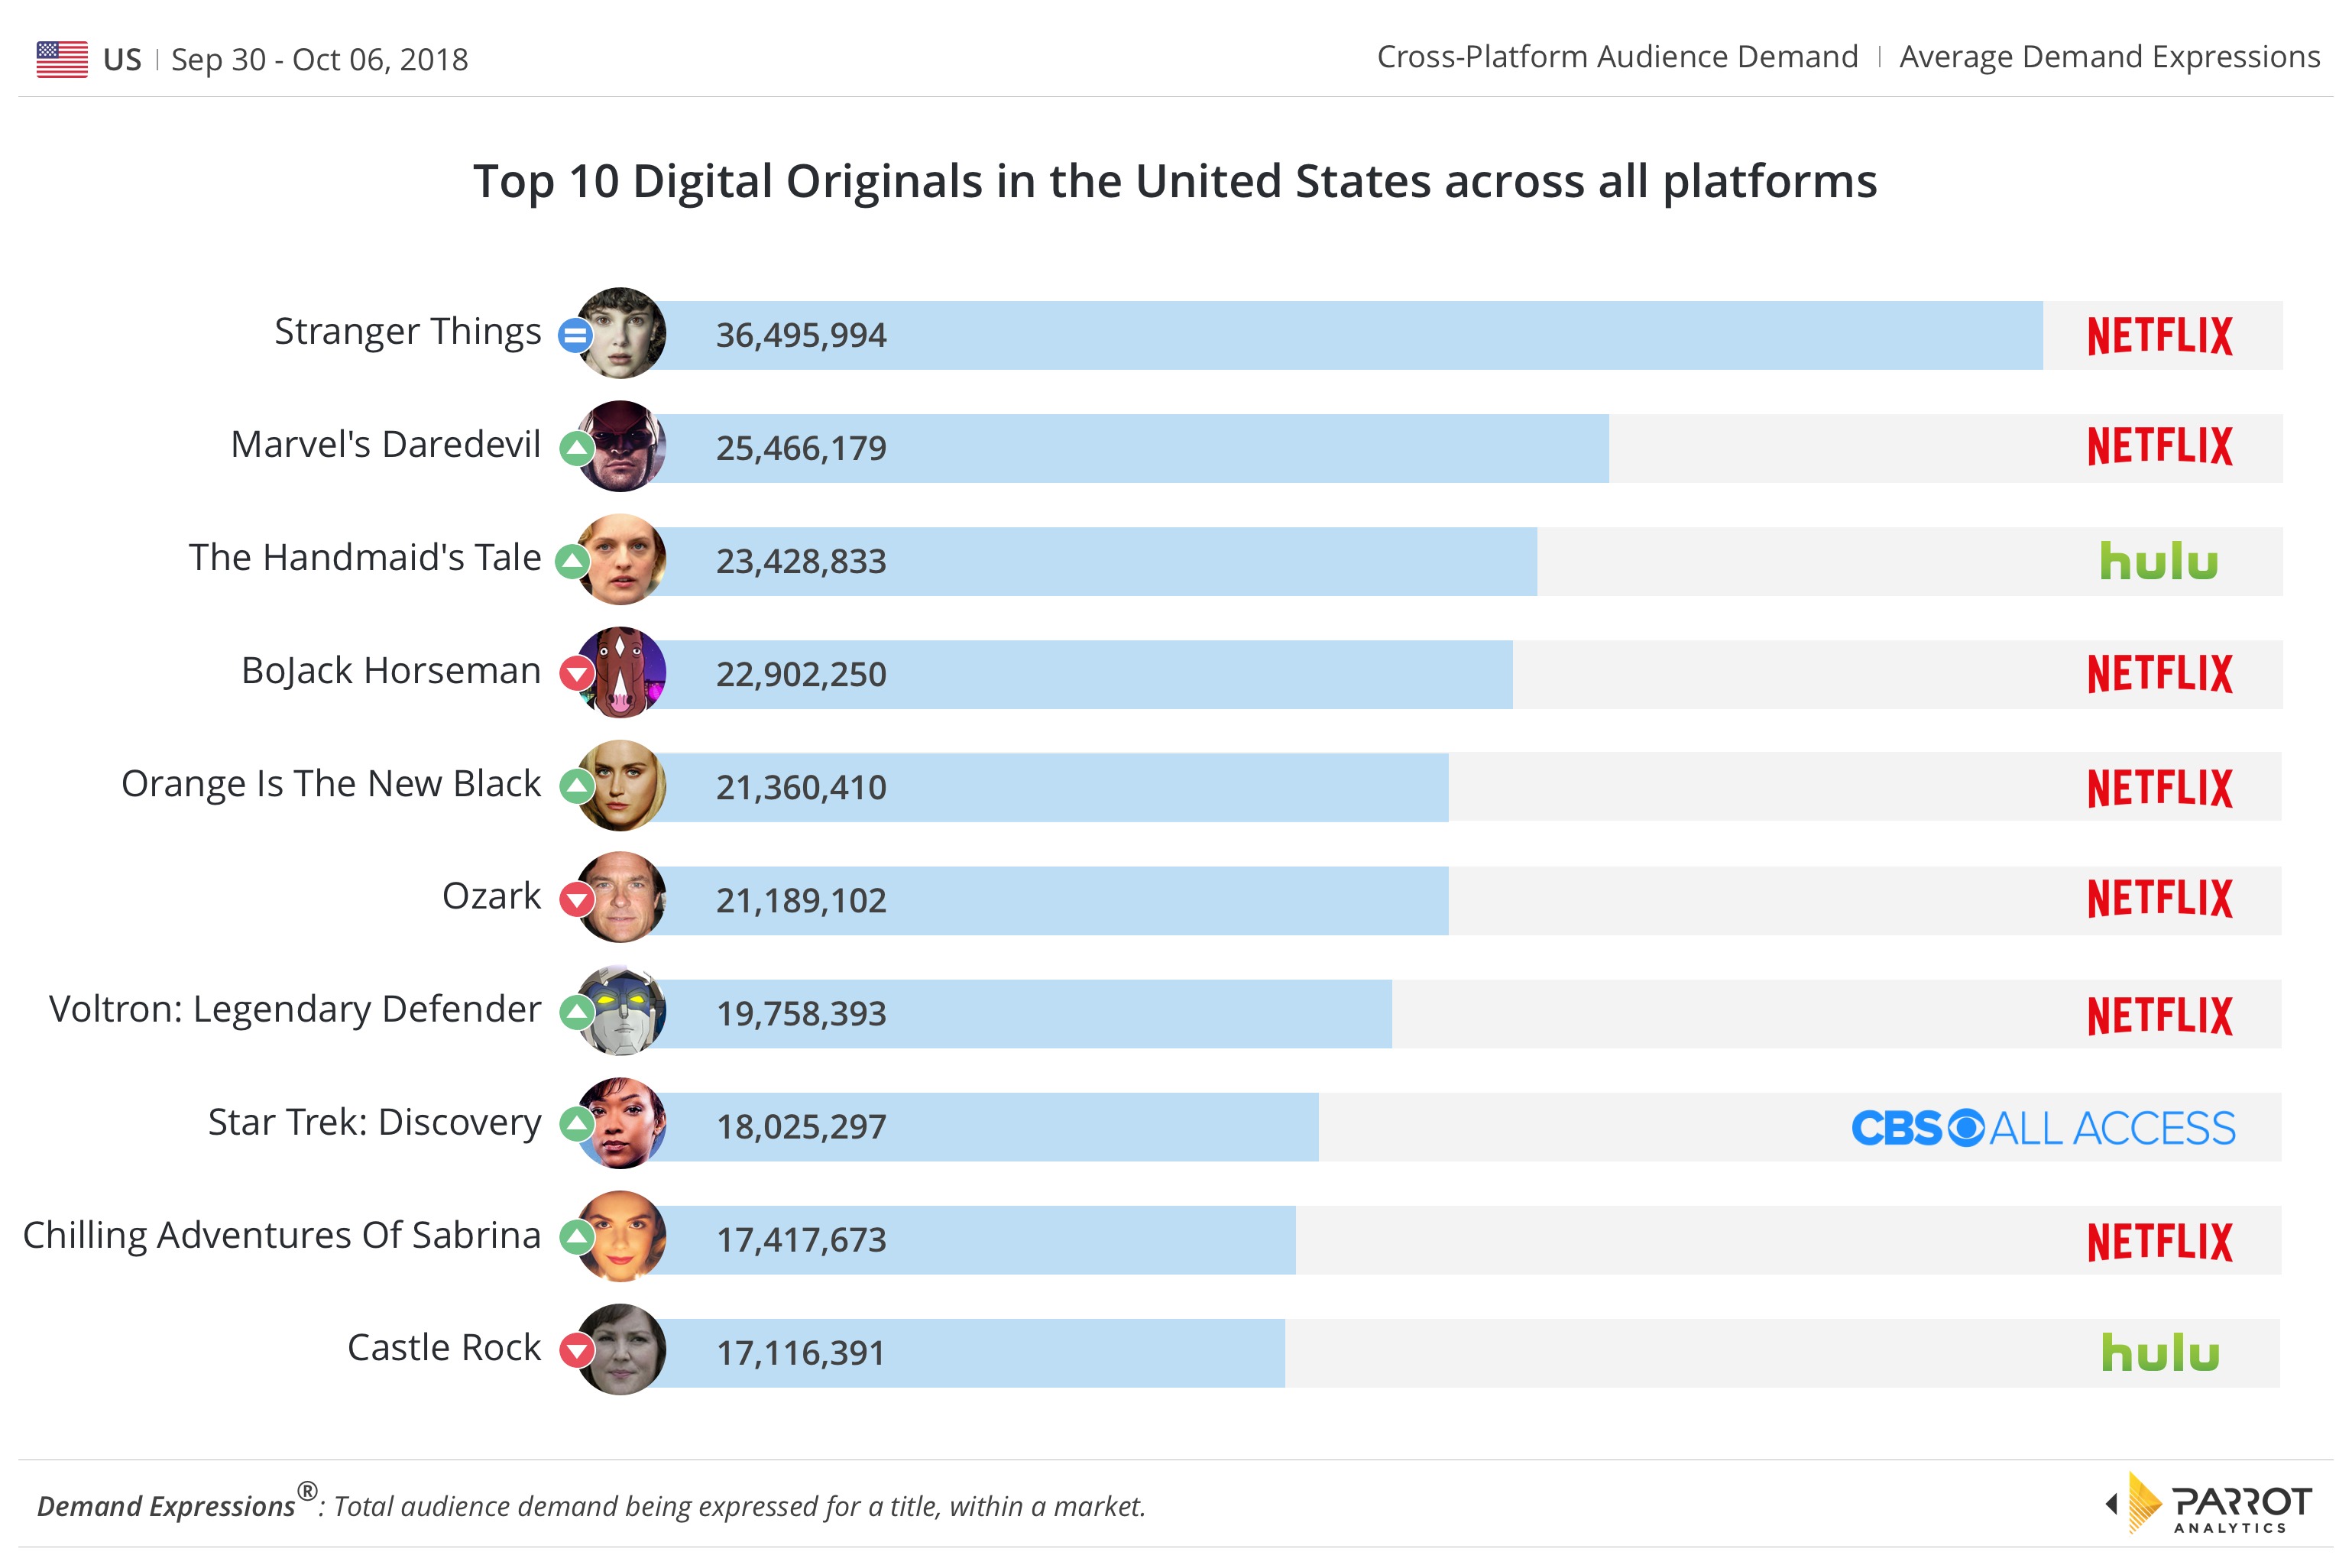
We have also observed that fan excitement is ongoing for Star Trek: Discovery from CBS All Access, ranked No. 8, partly due to the release of the first of four mini-episodes each focusing on a particular character from Discovery’s cast (the first episode was released on October 4th). We believe fans of the science-fiction series are re-watching old episodes and anticipation for season two appears to be strong.
The fall premiere for network shows has continued to generate buzz in the overall chart this week: The return of new episodes for The Walking Dead (+23%), The Good Place (+19%) and The Voice (+11%) all resulted in these titles jumping in demand week-on-week. Saturday Night Live has had the highest demand jump compared to the prior week as season 44 got underway on September 29th.
For more information, reach out to Parrot Analytics for a live demonstration of our Demand Portal, or read our Global TV Demand report.
The data in this article are based on Demand Expressions (DEX). DEX is the globally standardized TV measurement metric developed by Parrot Analytics, which represents the total audience demand being expressed for a title, within a market. Audience demand reflects the desire, engagement and viewership, weighted by importance; so a stream/download is a higher expression of demand than a ‘like’/comment.

