Image: Marvel’s Luke Cage, Netflix
Parrot Analytics’ demand measurement platform provides insight into global, country-specific audience demand for television content. Our global SVOD data measurement standard corresponds to the total audience demand being expressed for a title, within a market regardless of platform: Audience demand reflects the desire, engagement, and viewership of content consumers, weighted by importance; so a stream/download is a higher expression of demand than a ‘like’/comment.
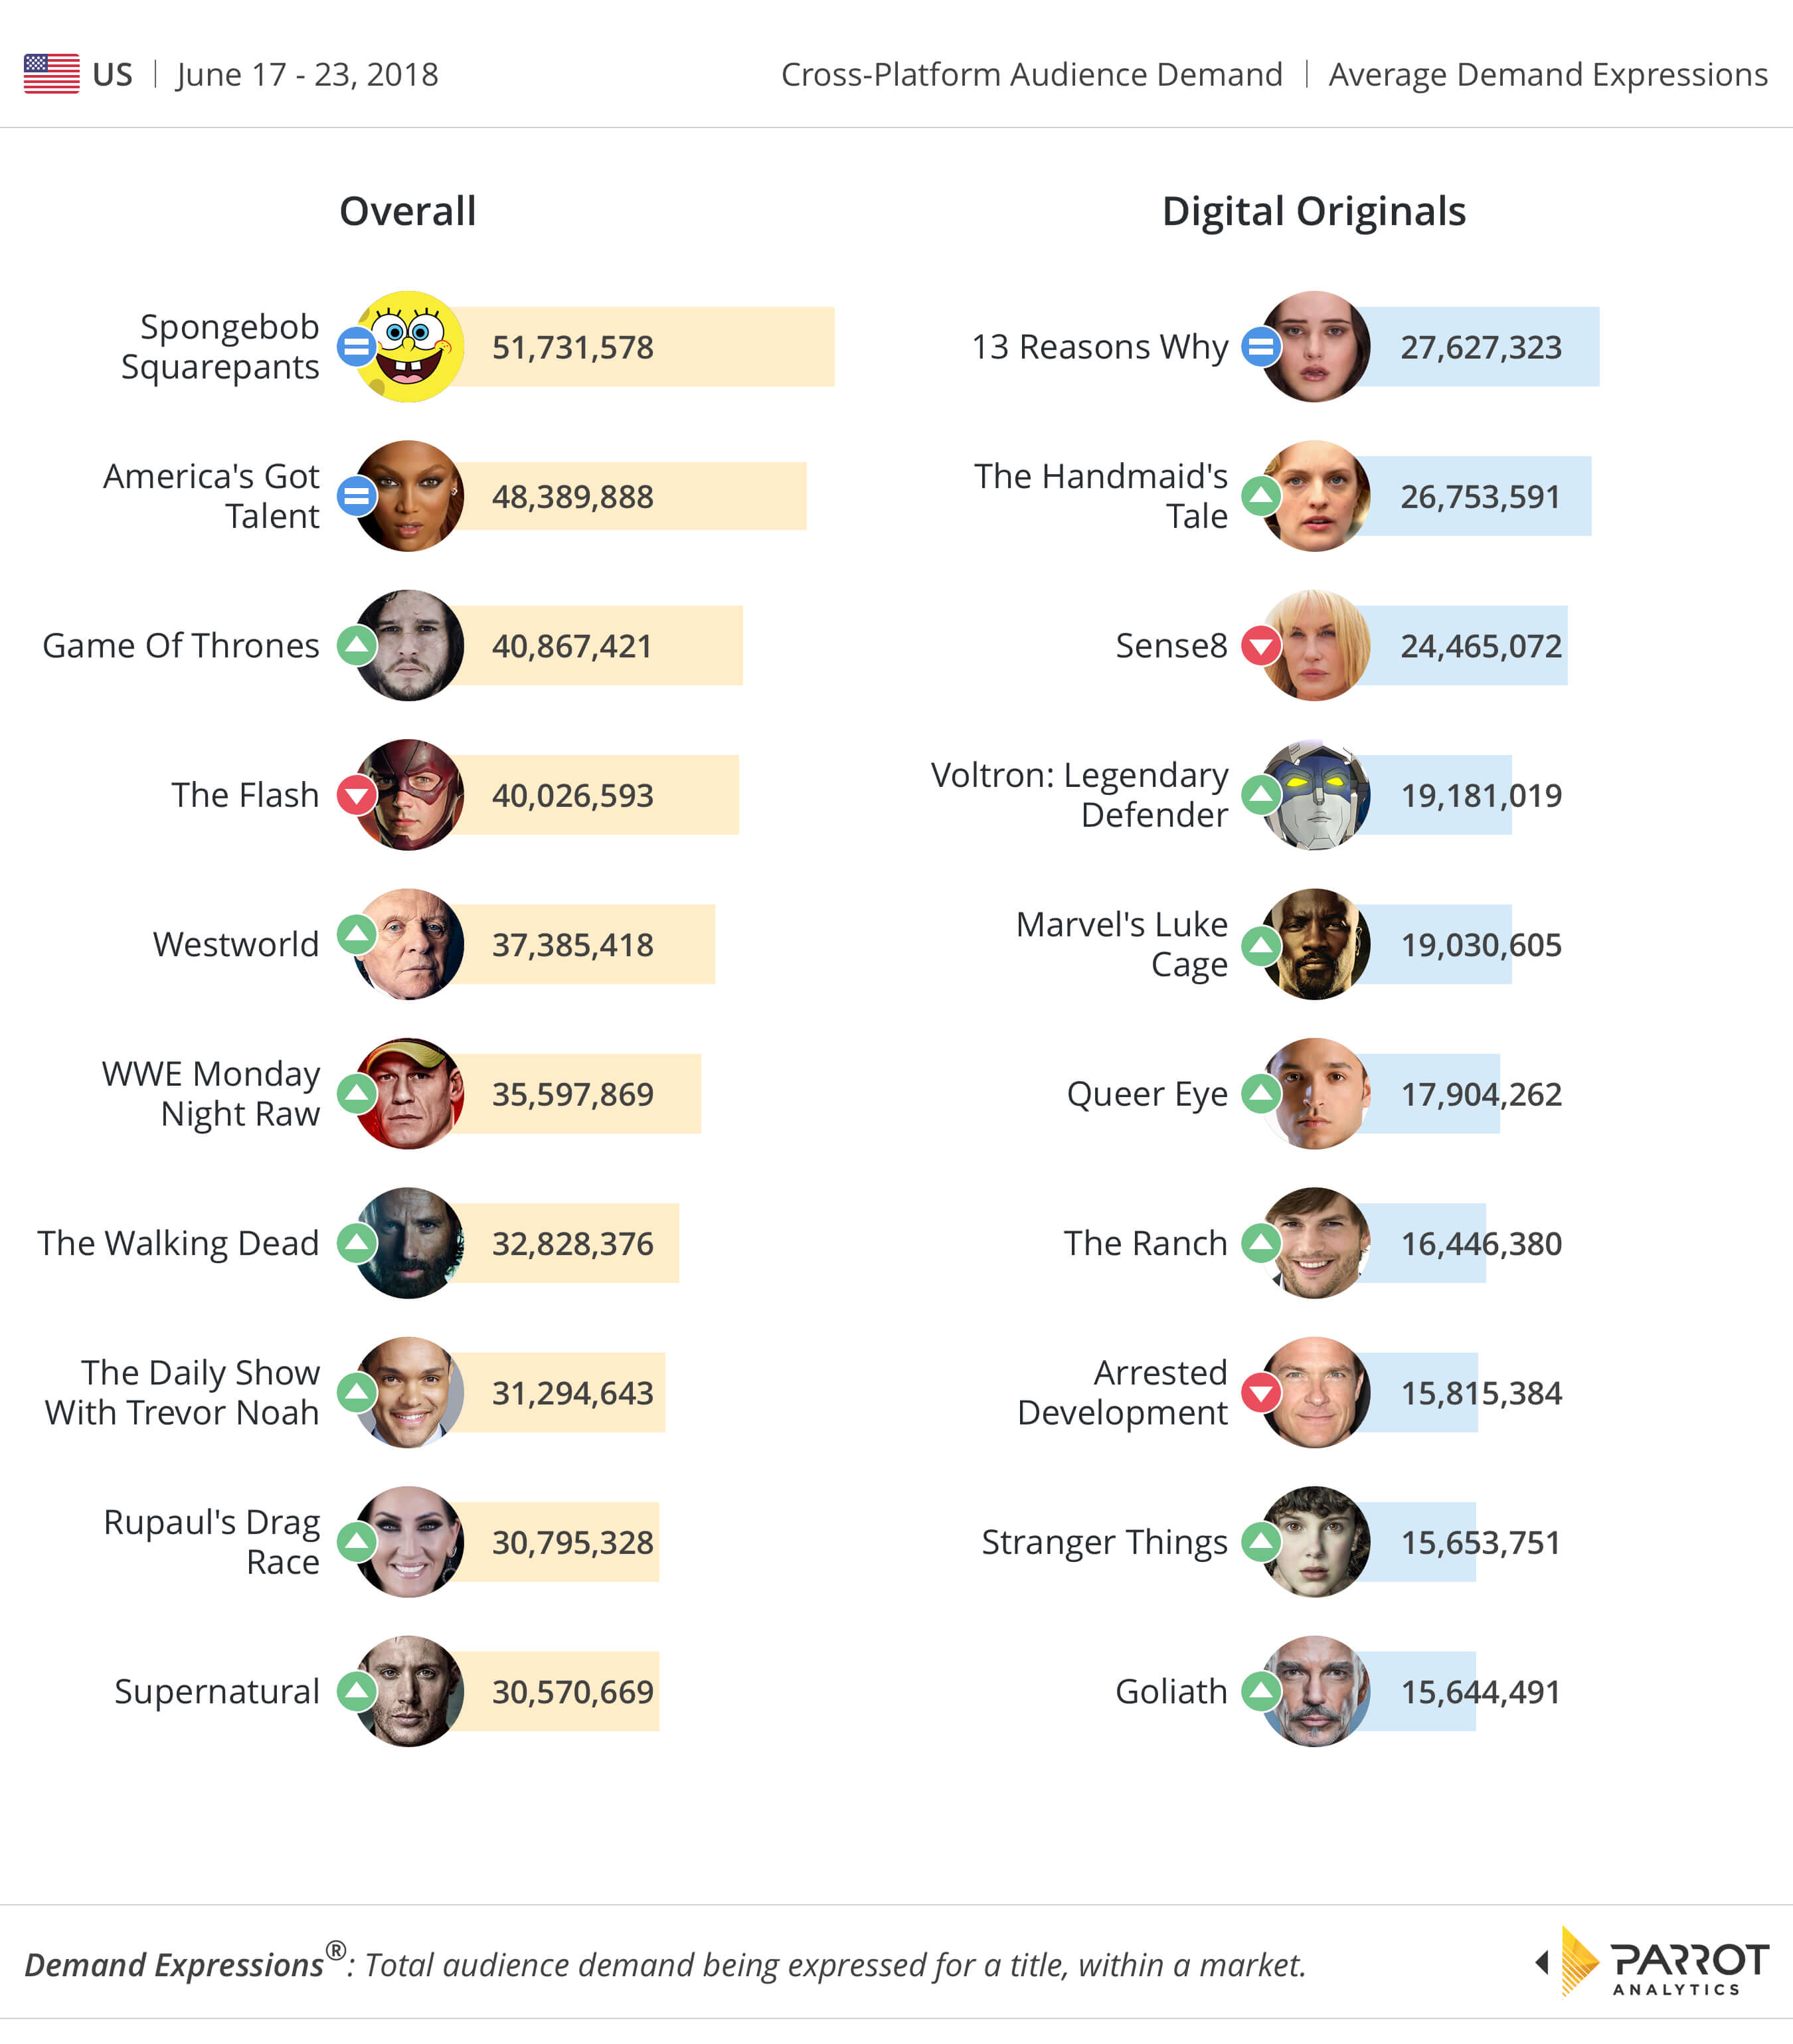
In our latest chart for the U.S. domestic market, there are three returning titles that we haven’t seen in a while: The second season of Marvel’s Luke Cage from Netflix debuted at #5 in the week ending June 23. The action series (previously ranked #16) had 6% more demand compared to Netflix’s Queer Eye (which managed a 2.5 times difference compared to the prior week); Queer Eye‘s second series also premiered in June. Also returning is Amazon’s Goliath (ranked #10, #18 in the prior week) which generated 15.6 million Demand Expressions. 13 Reasons Why continues to be #1.
The top two overall titles have continued to lead, SpongeBob Squarepants and America’s Got Talent, but demand dipped slightly compared to the previous week. The season finales also changed demand significantly for Westworld (previously ranked #6) and RuPaul’s Drag Race (losing the least demand compared to last week). Westworld’s fifth position is the highest the mind-bending science-fiction series has had since its season two debuted on April 22. Notably, The Daily Show With Trevor Noah (previously ranked #23) had more demand compared to RuPaul’s Drag Race.
For more information about trends in television, reach out to Parrot Analytics for a live demonstration our Demand Portal, or watch our latest product video.


