Photo: “Electronic Superhighway: Continental U.S., Alaska, Hawaii” by Nam June Paik (1995): 15 x 40 x 4 ft., at the Smithsonian American Art Museum. Credit: centralasian/flickr.com
The growing number of subscription-video-on-demand (SVOD) platforms have been ushering major changes to the landscape of the TV industry. Netflix introduced streaming video-on-demand (VOD) 12 years ago and in 2019 we find ourselves with almost every large entertainment, media or technology business throwing their respective hat in the ring to stake their claim for the attention and engagement of audiences.
Welcome back to the “30,000 Foot View” where we take a look at whether these new contenders stand a chance to deliver on what audiences are demanding, and more importantly, what some of the opportunities for monetization are in today’s “platform world”.
Please note, if you are new to our “30,000 Foot View” series, you can read our introduction in Chapter 1: The currency of the streaming wars.
The new “Boxers” in the SVOD streaming ring
For years, Netflix has been the clear streaming winner in the U.S. But the aptly named “Streaming Wars” are a homage to the intensifying competition in the SVOD portion of the business of television. Existing and new platforms are all geared towards holding audiences captive, engaged and interacting with content to maximize repeat subscription and minimize churn. 12 years after Netflix first launched we now find ourselves in a state of entertainment convergence: The Attention Economy.
While the new “SVOD boxers” are currently preparing in their respective corners, predictions abound concerning which of these new players will become victorious when they go “head-to-head”. Many have questioned how much of a threat these new platforms pose to Netflix and if any one of them will be a “Netflix killer”, with good reasoning as we discussed in Chapter 1.
Matthew Ball of Redef, however, notes that new contenders need to be careful in joining the other direct-to-consumer (D2C) platforms; in this space empathy towards consumer needs is king. Netflix, Amazon, and Hulu found a way into the heart of their respective audiences by solving consumer problems. While new SVOD platforms are aggregating content and focusing on what to license and what to produce, Mr Ball argues that this is actually creating problems for consumers: For example, by spreading out or removing consumers’ favorite content.
Mr. Ball wagers further that consumer problem-solving is the road to success for the new contenders, which of course are Apple TV+, HBOMax by WarnerMedia/AT&T, NBCU/Comcast’s recently announced Peacock, Quibi, and Disney+. It is not clear if solving the problem these services are creating, by taking back their content, will be enough to draw consumers to subscribe. After all, the problem/solution appears to be defined by what creates value for the platforms – and the end consumer is largely ignored in the process (7+ SVOD subs per month, anyone?) So in this regard we support Mr Ball’s position: Each service will likely need more than just their existing content to drive consumers to subscribe.
But, before we dive into that, let us first understand the value of this existing content and its potential to shake up the current market (e.g $500M+ for Seinfeld, now with Netflix).
The two battlefields for demand: Content distribution and content ownership
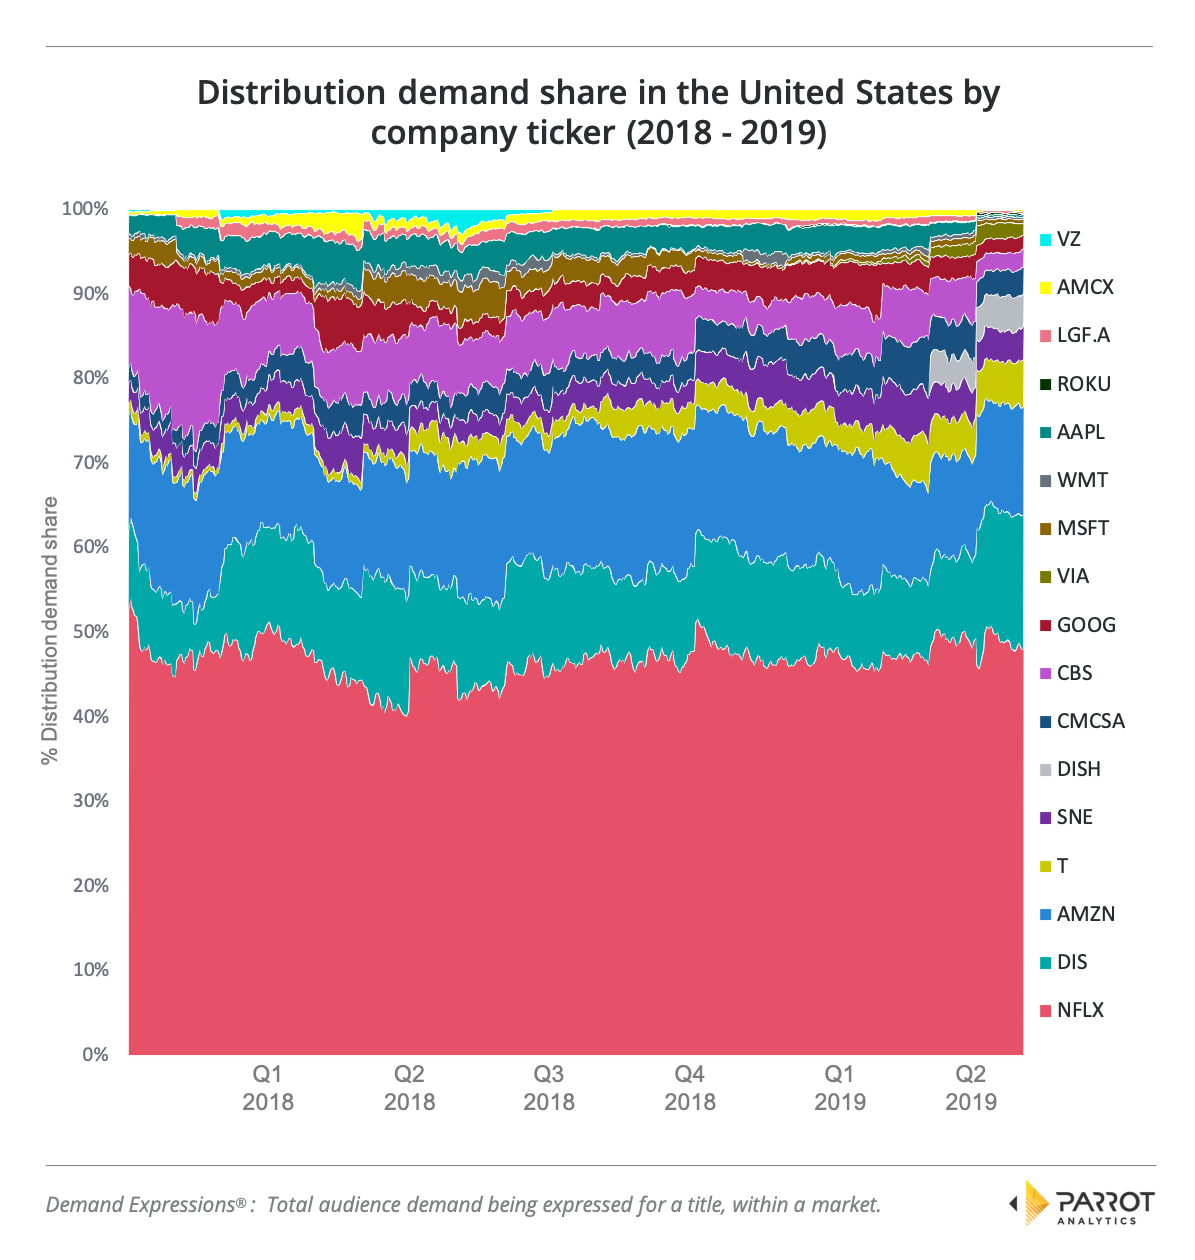
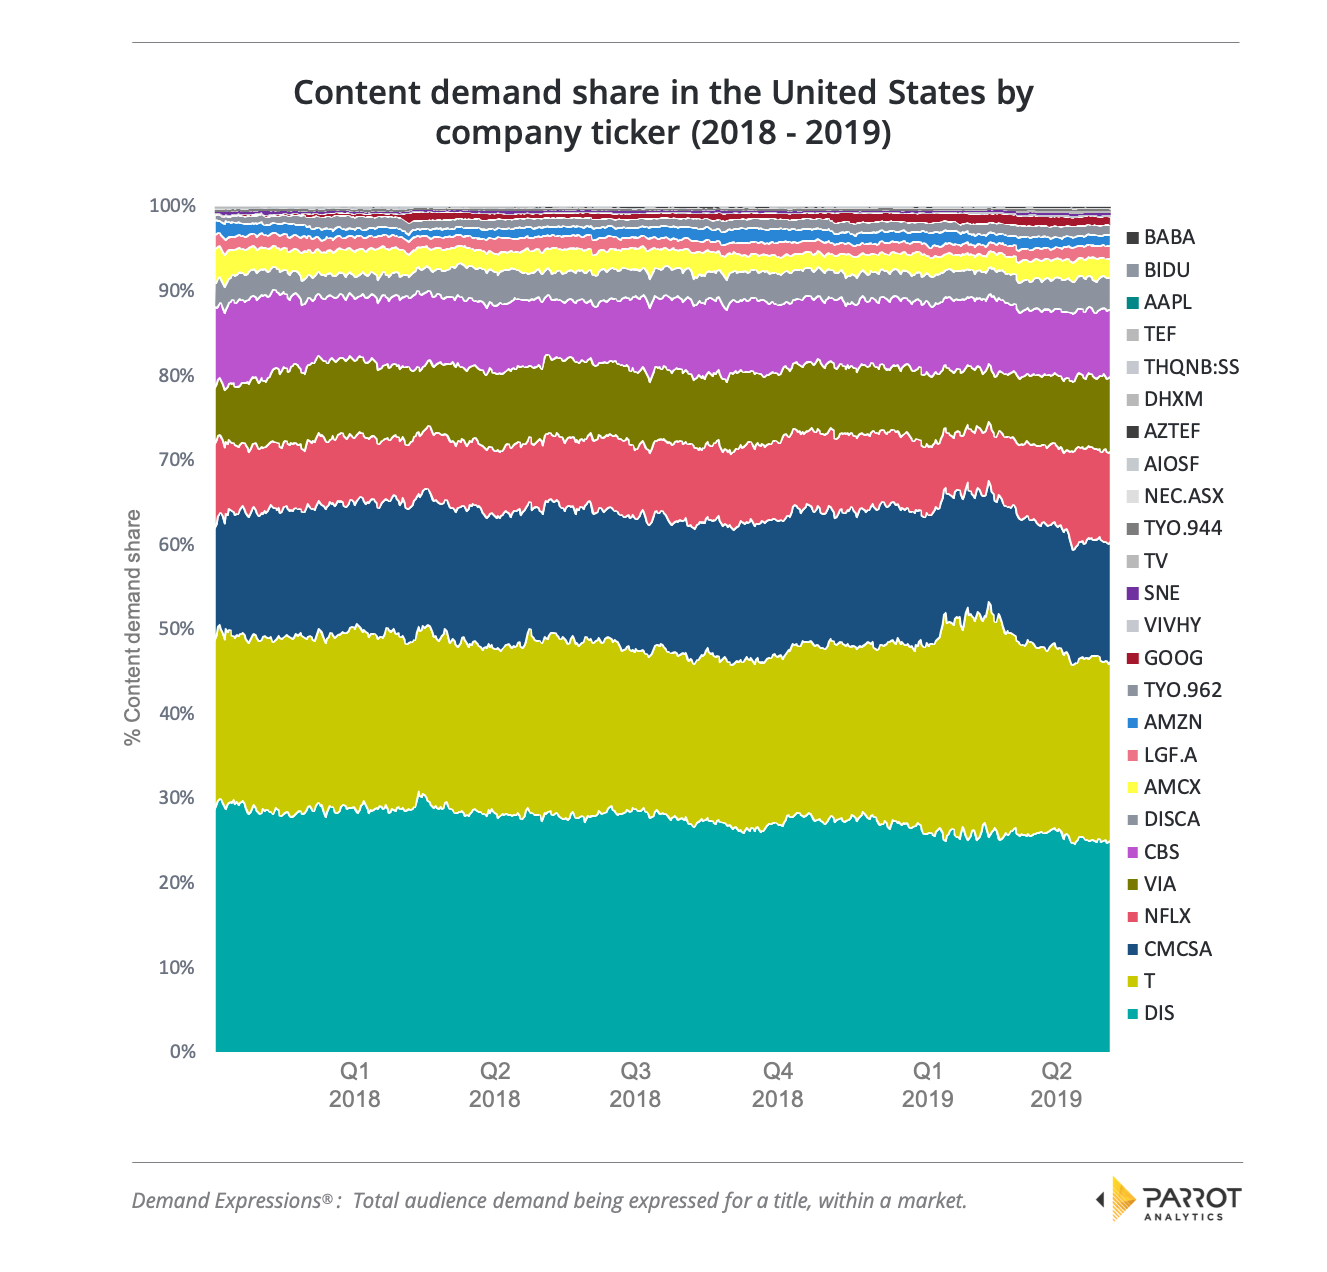
Market share as measured by demand has two layers: Distribution and ownership. Let us take a look at two charts focused on the United States market to demonstrate this. The first chart illustrates the demand share based on what percentage of demand each company holds in terms of the distribution of the content (total catalog) and the second chart is based on their ownership of the content (production). Before we go further it must be noted that these charts (and all others in this article) are based on demand for episodic tv series (films are excluded).
In the first chart, we see that Netflix’s (NFLX) catalog has control over almost half of the distribution demand in the US, followed by Hulu (DIS) and Amazon’s Prime Video (AMZN).
Let us pause for a moment and ask if that make sense. When we consider Netflix’s strength as a content distributor over the last decade, one cannot overlook that the streaming disrupter has a strongly established brand with users and is a now staple in most homes, even becoming a cultural phenomenon (“Netflix and Chill”). This brand and distribution strength is reflected in its content distribution demand share.
In terms of the demand share of its produced content in the U.S., the below chart demonstrates how the story shifts dramatically: Disney (DIS) and AT&T/WarnerMedia (T) titles are driving the majority of audience demand in the U.S. market. So although Netflix currently owns the greatest single portion of the demand share due to its position as a distributor at over 40% (chart 1), the service only produces and owns content that amounts to around 10% of total U.S. audience demand.
Despite currently not driving any subscribers to a platform, the existing content that Disney, AT&T, and NBCU/Comcast own is significantly in demand. The demand of shows such as The Office and Friends have maintained audience demand for years. With Netflix losing these series going forward, only time will tell how the shifting of such in-demand content will impact on the loyalty of existing Netflix subscribers.
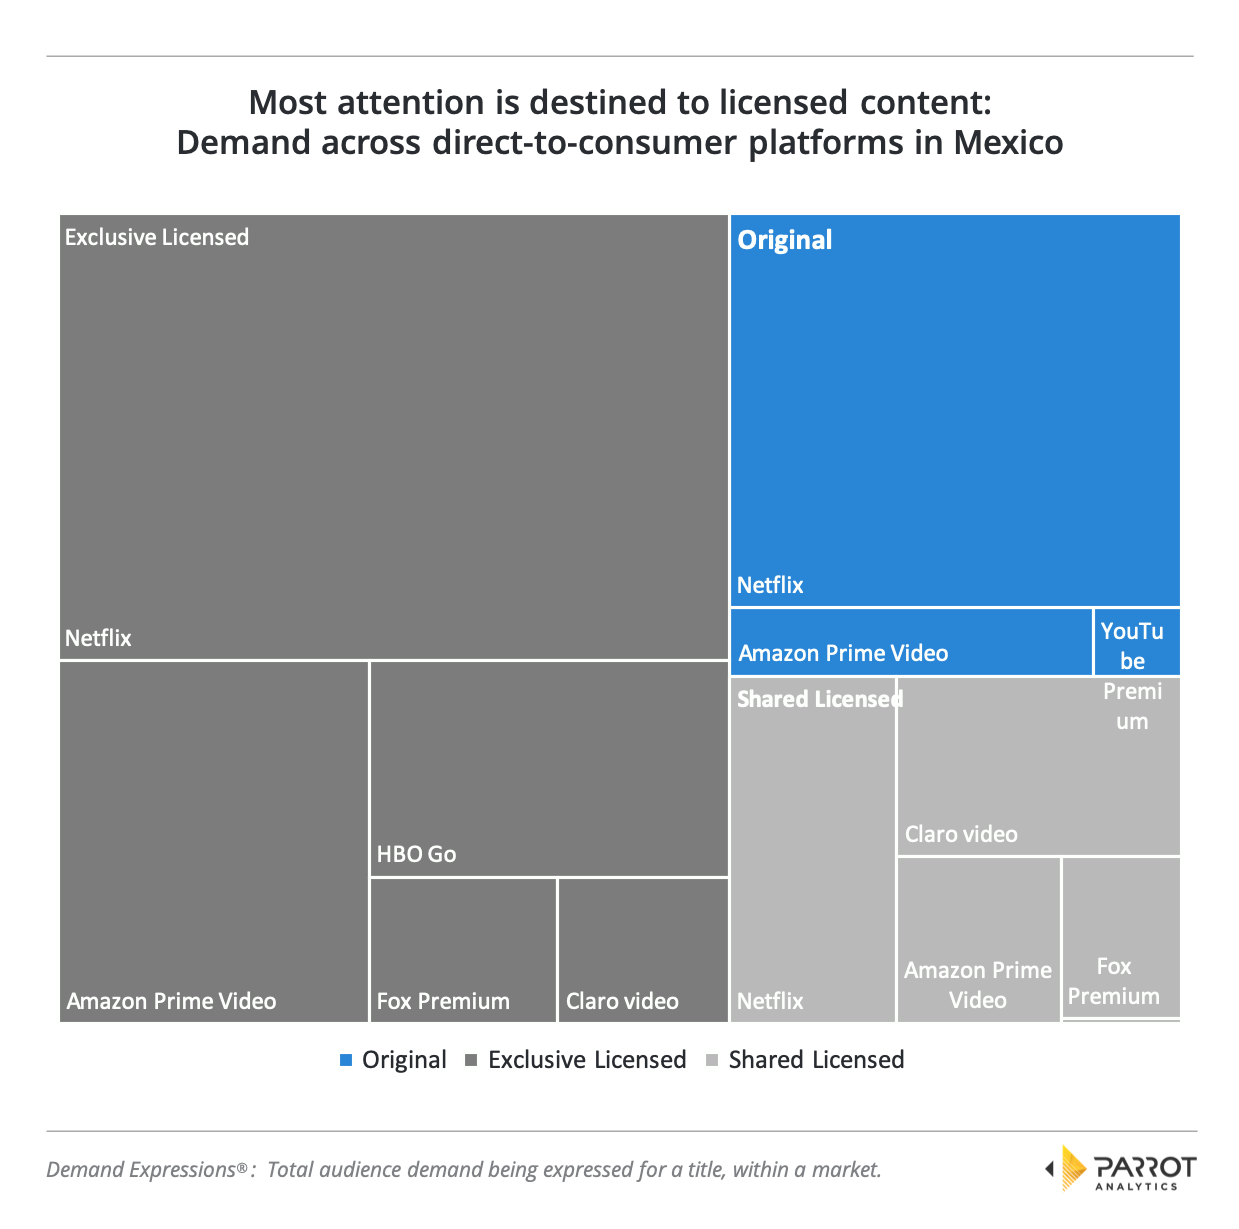
To help illustrate these industry dynamics further, in the context of ownership and distribution in the global multi-platform TV world, let us now briefly jump to an international market for just a moment and cut the data in a slightly different way. Here is what the Mexican content ecosystem looks like in terms of audience demand for:
- Exclusive licensed content (dark grey).
- Shared licensed content (light grey).
- Platform original content (blue).
It is clear that most consumer attention is focused on licensed content with digital original content attracting approximately a quarter of the total market demand in Mexico.
As this chart demonstrates, Parrot Analytics is able to deliver strategic content demand analyses not only for the US, but also for international markets. We are able to do this because we have built and operate the world’s largest audience demand database. Global TV demand data has rapidly established itself as a global TV currency and is helping our clients make the most powerful decisions every day: For example, we work with our partners to inform content investment and co-production decisions, content sales pricing, acquisitions, programming, marketing and sponsorship initiatives. If you have a complex TV business challenge you need help navigating, please reach out to our partnerships team.
Let us now examine the “distribution path to victory” followed by an in-depth analysis of the digital originals landscape in the United States.
The distribution path to victory
The “war” between streaming platforms is set to occur on these two battlefields: Content distribution and content ownership. To win, players will aim to claim victories on both. How does one find triumph on the battlefield of content distribution?
The first path to a victory is creating positive user experiences that reduce consumer decision-fatigue or an experience of content overload. Julia Alexander, a reporter from The Verge, suggests Disney is well aware of this. After demoing the soon-to-launch Disney+, she shared that the site reflects an aim to solve some of Netflix’s user-experience issues by improving the ease of navigation through its content. And if early reports are to be believed (“Disney+ is ‘more addictive than heroin’”) – feedback from users of a two months free trial currently underway in The Netherlands – Disney+ is onto something.
The second important pillar of becoming a winning distributor involves licensing the most in-demand content. Thus, SVOD platforms must answer the following four strategic acquisition questions:
- What metrics are used to establish which titles are most impactful?
- How is clarity gained about each title’s contribution to existing platform subscribers?
- How can each title’s impact on subscriber acquisition and retention be quantified?
- How should acquisition titles be ranked on the basis of return on investment?
By answering these four questions, subscriber acquisition is maximised and churn is minimized on a per acquired title basis.
On the battlefield of content distribution and ownership, if existing highly in-demand content is perhaps not the surefire way to win, then how else can one compete? Digital original productions.
Standing a chance: If digital originals create winners, who is winning?
If an SVOD platform’s primary aim is to grow subscribers, the primary question to ask should be how one produces the strongest catalog of originals. Is one, two or three hit series enough to attract subscribers – and if so, how does one keep them?
The lay of the land: U.S. domestic
Before we consider where NBCUniversal, HBO Max, Disney+, Apple TV+ and Quibi should be focusing production and investment – let us first get a “lay of the land” in the U.S. to understand and learn from the existing players.
Netflix’s blockbusters and its large catalog of digital original TV series generate significant demand in the U.S. It appears that Netflix has benefited from the head start the service has enjoyed by understanding, connecting, and building an audience of streamers who prefer Netflix Originals. The chart below is clear in this respect.
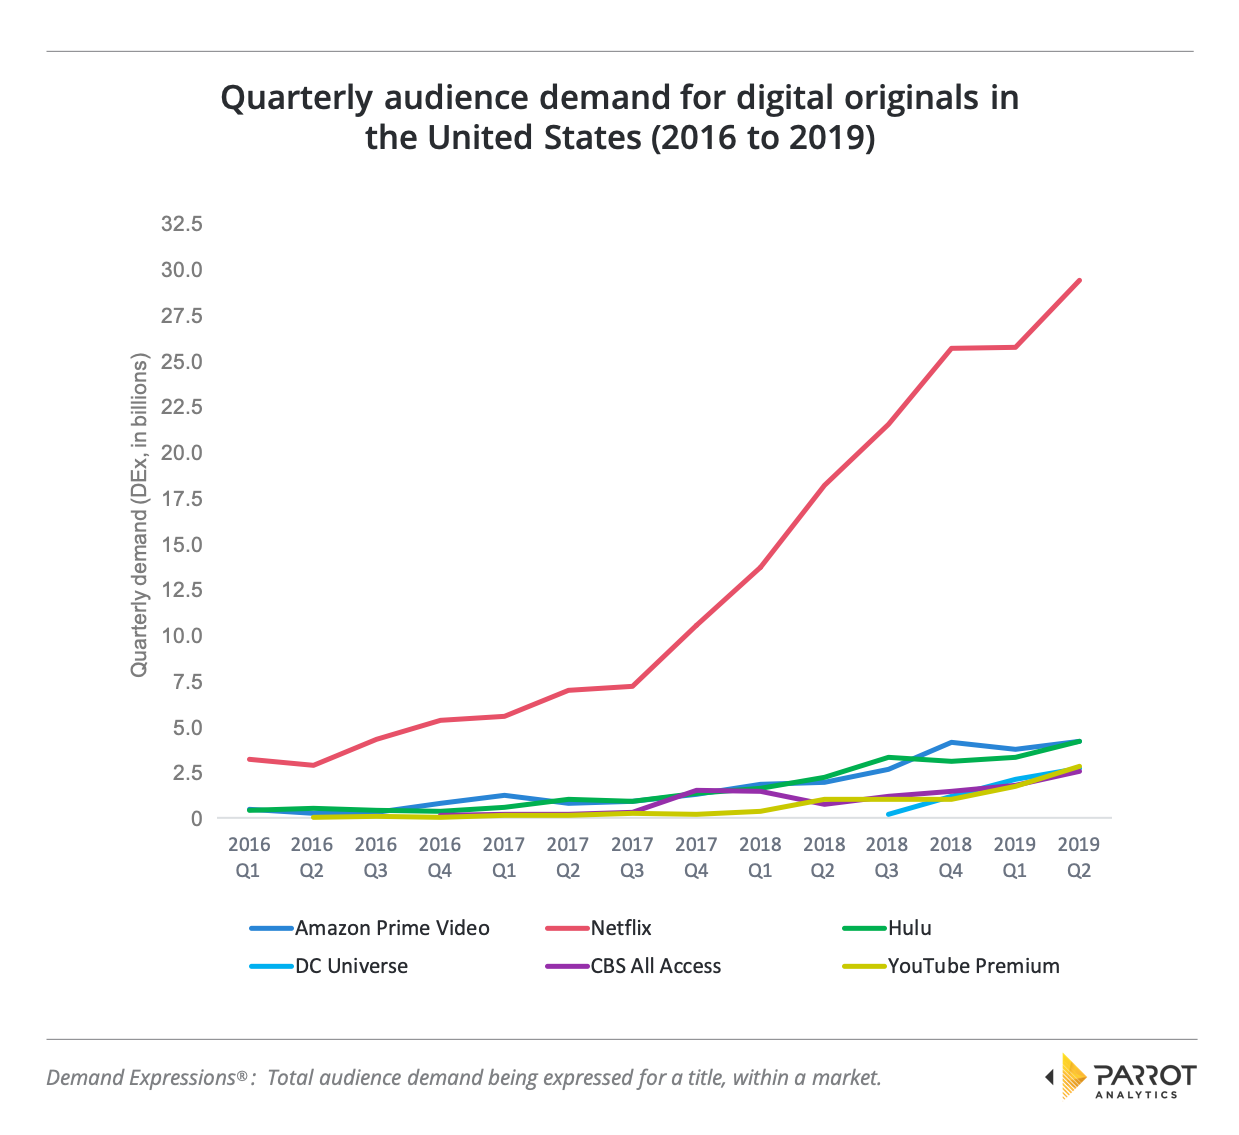
As Netflix has continued to build out its library, over the years Hulu and Amazon Prime Video have each increased the amount of demand their digital original titles are capturing in the US as well. Amongst many other great originals, Hulu has delivered fantastic hits such as The Handmaid’s Tale and The Act, and Prime Video amongst many others has had success with The Grand Tour, The Marvelous Mrs Maisel and (more recently) The Boys, even outperforming Netflix’s The Umbrella Academy, which have all contributed to the increase in the total catalog demand.
In this section we have demonstrated the increase in demand for digital originals on each platform. With each player releasing a continuous stream of new originals, what does demand data reveal when we consider catalog size? In the following section we will investigate how Hulu has fared against Netflix on a title average basis.
A close up of two incumbents: Netflix vs. Hulu
These two SVODs are interesting to compare due to their differing models as content distributors and content owners. Where Netflix aims to replace traditional TV with a focus on owning premium television, Hulu no doubt has plans for the same but also appears to want to become a “bundler distribution platform”, allowing it to sell additional products and services and becoming the distribution gateway for premium video.
Meanwhile, Netflix has remained ad-free while Hulu bases its revenue on ads, subscription revenue and partnership deals. Thus, Netflix has pursued digital originals more vigorously than Hulu, or any other SVOD, spending billions of dollars on production for almost 400 originals. Conversely, Hulu has been growing their originals a bit more slowly, though with almost 100 originals today this is now a respectable catalog size.
Netflix has also been vigorously pursuing international expansion and the global marketing machine that Netflix has built around its originals is strong. So strong in fact that most subscribers outside of the U.S. would not realize that, for example, Star Trek: Discovery is in fact not really a Netflix production. Heavily marketed as a “Netflix Original” outside of the U.S., this right came via the heavy price tag of carrying almost all of the risk and cost. Of course, by strategically employing these kind of co-licensing deals, Netflix is playing the long term game: To dominate the international markets.
But closer to home, which of these two platforms is producing the kind of originals that, on average, resonate the most with U.S. audiences?
As the chart below shows, the per title audience demand in the U.S. between the average Hulu Original and the average Netflix Original has diminished between 2016 and 2019. In fact, in the last quarter analyzed (Q2), on average, Hulu Originals are more in demand in the U.S. compared to the average Netflix Original.
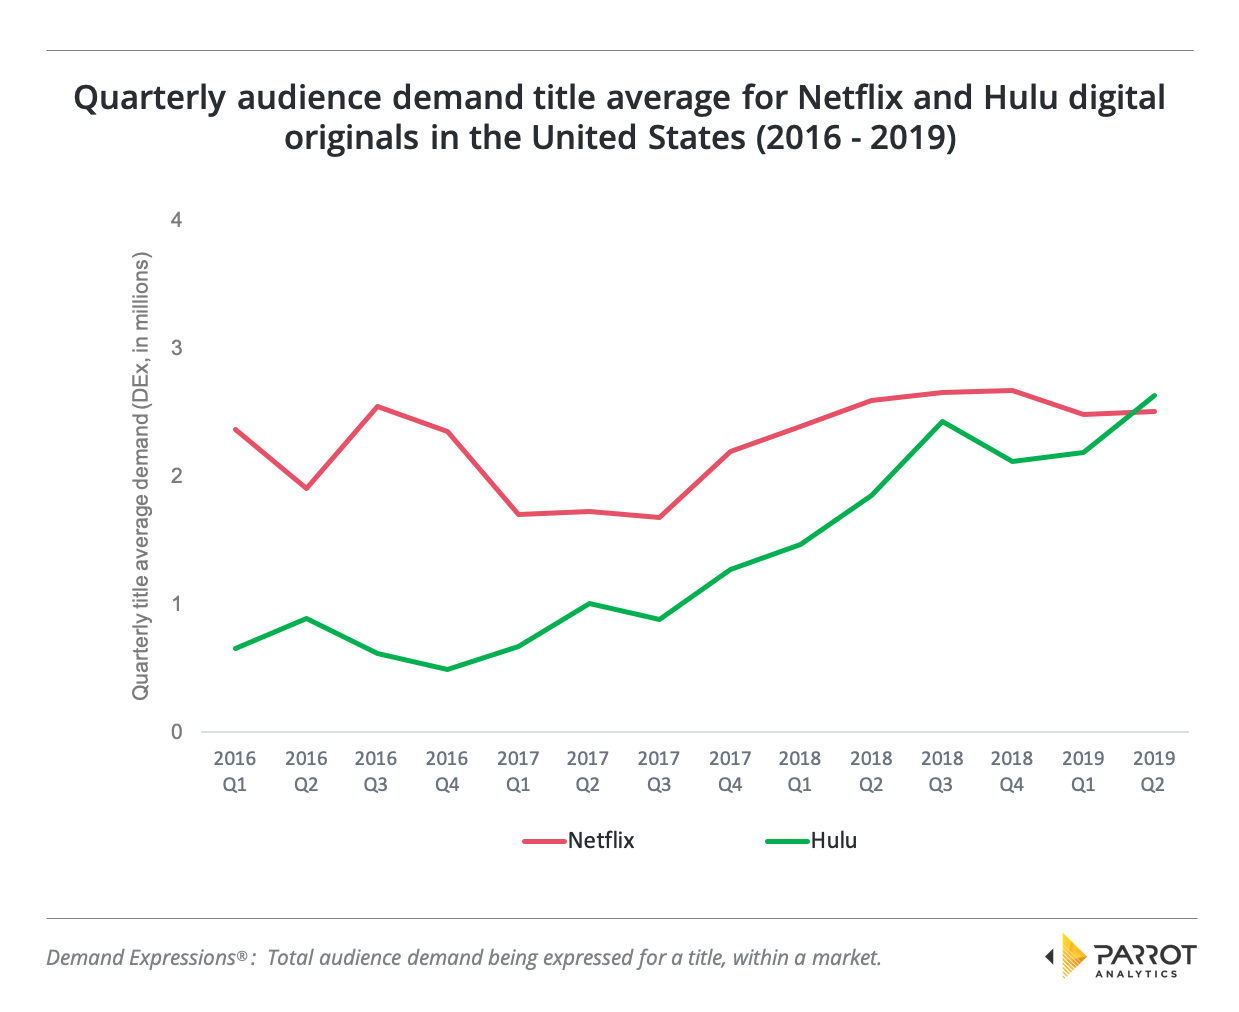
Our chart clearly shows how the per title demand for Hulu Originals has more than doubled since 2016. With less than a quarter of the size of Netflix’s originals library, Hulu Originals have become neck-on-neck competitors to Netflix Originals on the back of the obvious successes such as The Handmaid’s Tale but also Harlots, Castle Rock, Future Man and I Love You, America.
Meanwhile, the demand for the average original title in Netflix’s catalogue has remained stagnant. The average popularity of Netflix’s catalog, which has only grown significantly in the least 3 years, has been subject to the long-tail of content. There are two key factors that impact on the demand average: It is a given that not all digital originals are mainstream “hits” and at the same time, Netflix has been executing as planned on its niche shows strategy (resulting in titles that resonate highly with a niche but with low market demand overall).
Of course, there is no doubt that the service has been seeking to secure other tentpole hits next to Stranger Things. And some even claim that it can no longer afford to produce less successful originals, and that audiences can expect more cancellations of their favorite shows. But in an environment where even with the best talent, large budgets and IP success is not guaranteed, Netflix has recognised that shows targeted to specific audience interests (irrespective of how mainstream or not such interests may be) is expected to yield a better long-term return on investment – especially on the global stage.
One point of clarification remains: It must be noted that Netflix’s mega hit, Stranger Things, was only contributing marginally to the Q2 average in the lead up to its July 4, 2019 season 3 release in the chart above. We therefore expect the Netflix Originals title average to exceed the Hulu Originals title average for the third quarter of 2019 once Stranger Things season 3 is factored in.
This can be demonstrated with a quick animation which shows the significant increase in audience demand following season 3. Whilst this particular visualization is focused on Europe, Stranger Things’ third season will no doubt be contributing positively towards Netflix’s Q3 demand title average in markets around the world, including the United States.
(Sidenote: Did you find this visualization interesting? We have plenty more here for you to enjoy).
So, these two early streamers have clearly led the charge and demonstrated that digital originals are capturing the attention and hearts of audiences. Yet, as we all know, they are no longer the only boxers in the ring.
Not The Same Crowd
If we refer back to the chart representing the total demand for originals per platform, there have also been a few impressive newcomers next to Amazon Prime Video that are proving that there is an opportunity to thrive, even in an as hotly contested content market as the U.S. YouTube Premium, for example, has come to compete on the premium drama front with the likes of Netflix, Hulu, and Prime Video via – for example – a brilliantly nostalgic, yet entirely new show: Cobra Kai. In fact, for a one week period in April 2019, the series was the most in-demand digital original series in the world.
Elsewhere, CBS All Access has built a successful, though perhaps modest library of digital originals. Star Trek: Discovery in particular is one of the key drivers of total platform demand in the U.S. And internationally, Parrot Analytics global TV demand data reveals that the series is as popular as ever with Germans. CBS appears to hope to continue to slowly add winning originals, like the upcoming 10-episode adaptation of Stephen King’s The Stand. But once again, not all titles will be “hits”, and so we know that in the near future CBS All Access like all SVODs will need to consider how to continue to build out its library to stay competitive.
DC Universe’s (DCU) SVOD platform – often completely overlooked – has also proven to be successful, revealing HBO Max’s potential to draw on DCU’s fanbase to contribute towards becoming a strong contender in the Streaming Wars. This niche platform has commanded a large increase in U.S. demand in 2019, quickly earning total quarterly demand to be competitive with the likes of YouTube Premium shows and CBS All Access which have existed as SVODs for much longer. DC Universe’s story of success has been built on fandom, in a highly sought-after superhero subgenre.
And then of course there is Facebook Watch – perhaps one of the most under-hyped television platforms in the world, with arguably one of the best chances of bringing hundreds of millions of people together to engage with content. The Facebook Watch team has been quietly building out its originals library and the platform is on a mission to help its audiences connect more meaningfully with likeminded people to watch a series together, instead of watching a show passively and in a solitary manner. Facebook Watch claims that its 140M daily Watch users consume on average 26 minutes of videos on Watch every day.
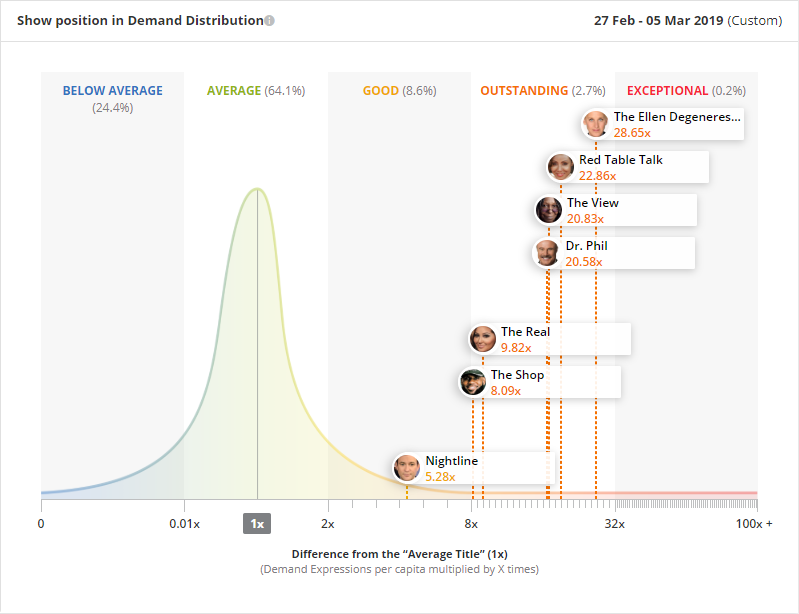
Parrot Analytics global TV demand can easily be used to substantiate the success of Facebook Watch, let us take Red Table Talk as an example. The March 2019 episode where Jordyn Woods gives her exclusive interview about her involvement with NBA Star Tristan Thompson, the father of Khloe Kardashian’s daughter, propelled Red Table Talk to be the second most in-demand talk show in the United States, right behind The Ellen DeGeneres Show. This resulted in Red Table Talk attracting 22.9 times more demand from audiences in the U.S. that week compared to the average TV show, securing the title the “Outstanding” category which is only reached by 2.7% of all titles in the United States.
Conclusion
In Chapter 2 we have examined the content battlefield in terms of distribution and ownership. We have learnt that market share, as measured by demand, has two layers, which illustrate audience demand share based on either what percentage of demand companies hold in terms of content distribution, or content ownership.
So how does one navigate this changing content landscape in 2020?
And will the new contenders be able to attract the necessary audience attention to knock out the existing competition long term?
At Parrot Analytics we have analyzed a few of the industry-defining trends that will drive market players towards success In Chapter 3 of this series. We hope that you will join us again for the next chapter where we will reveal the power of finding ripe white spaces for specific content genres, as well as compelling uses cases to exploit Intellectual Property (IP) for specific genres.

