Image: Game of Thrones, HBO
Parrot Analytics’ weekly top 10 television charts are based on demand data, which is globally standardized, incorporating numerous global inputs such as peer-to-peer and streaming content consumption data, resulting in TV content analytics data that is cross-platform and available for 100+ countries. As always, let us now investigate the U.S. domestic market as we do every week.
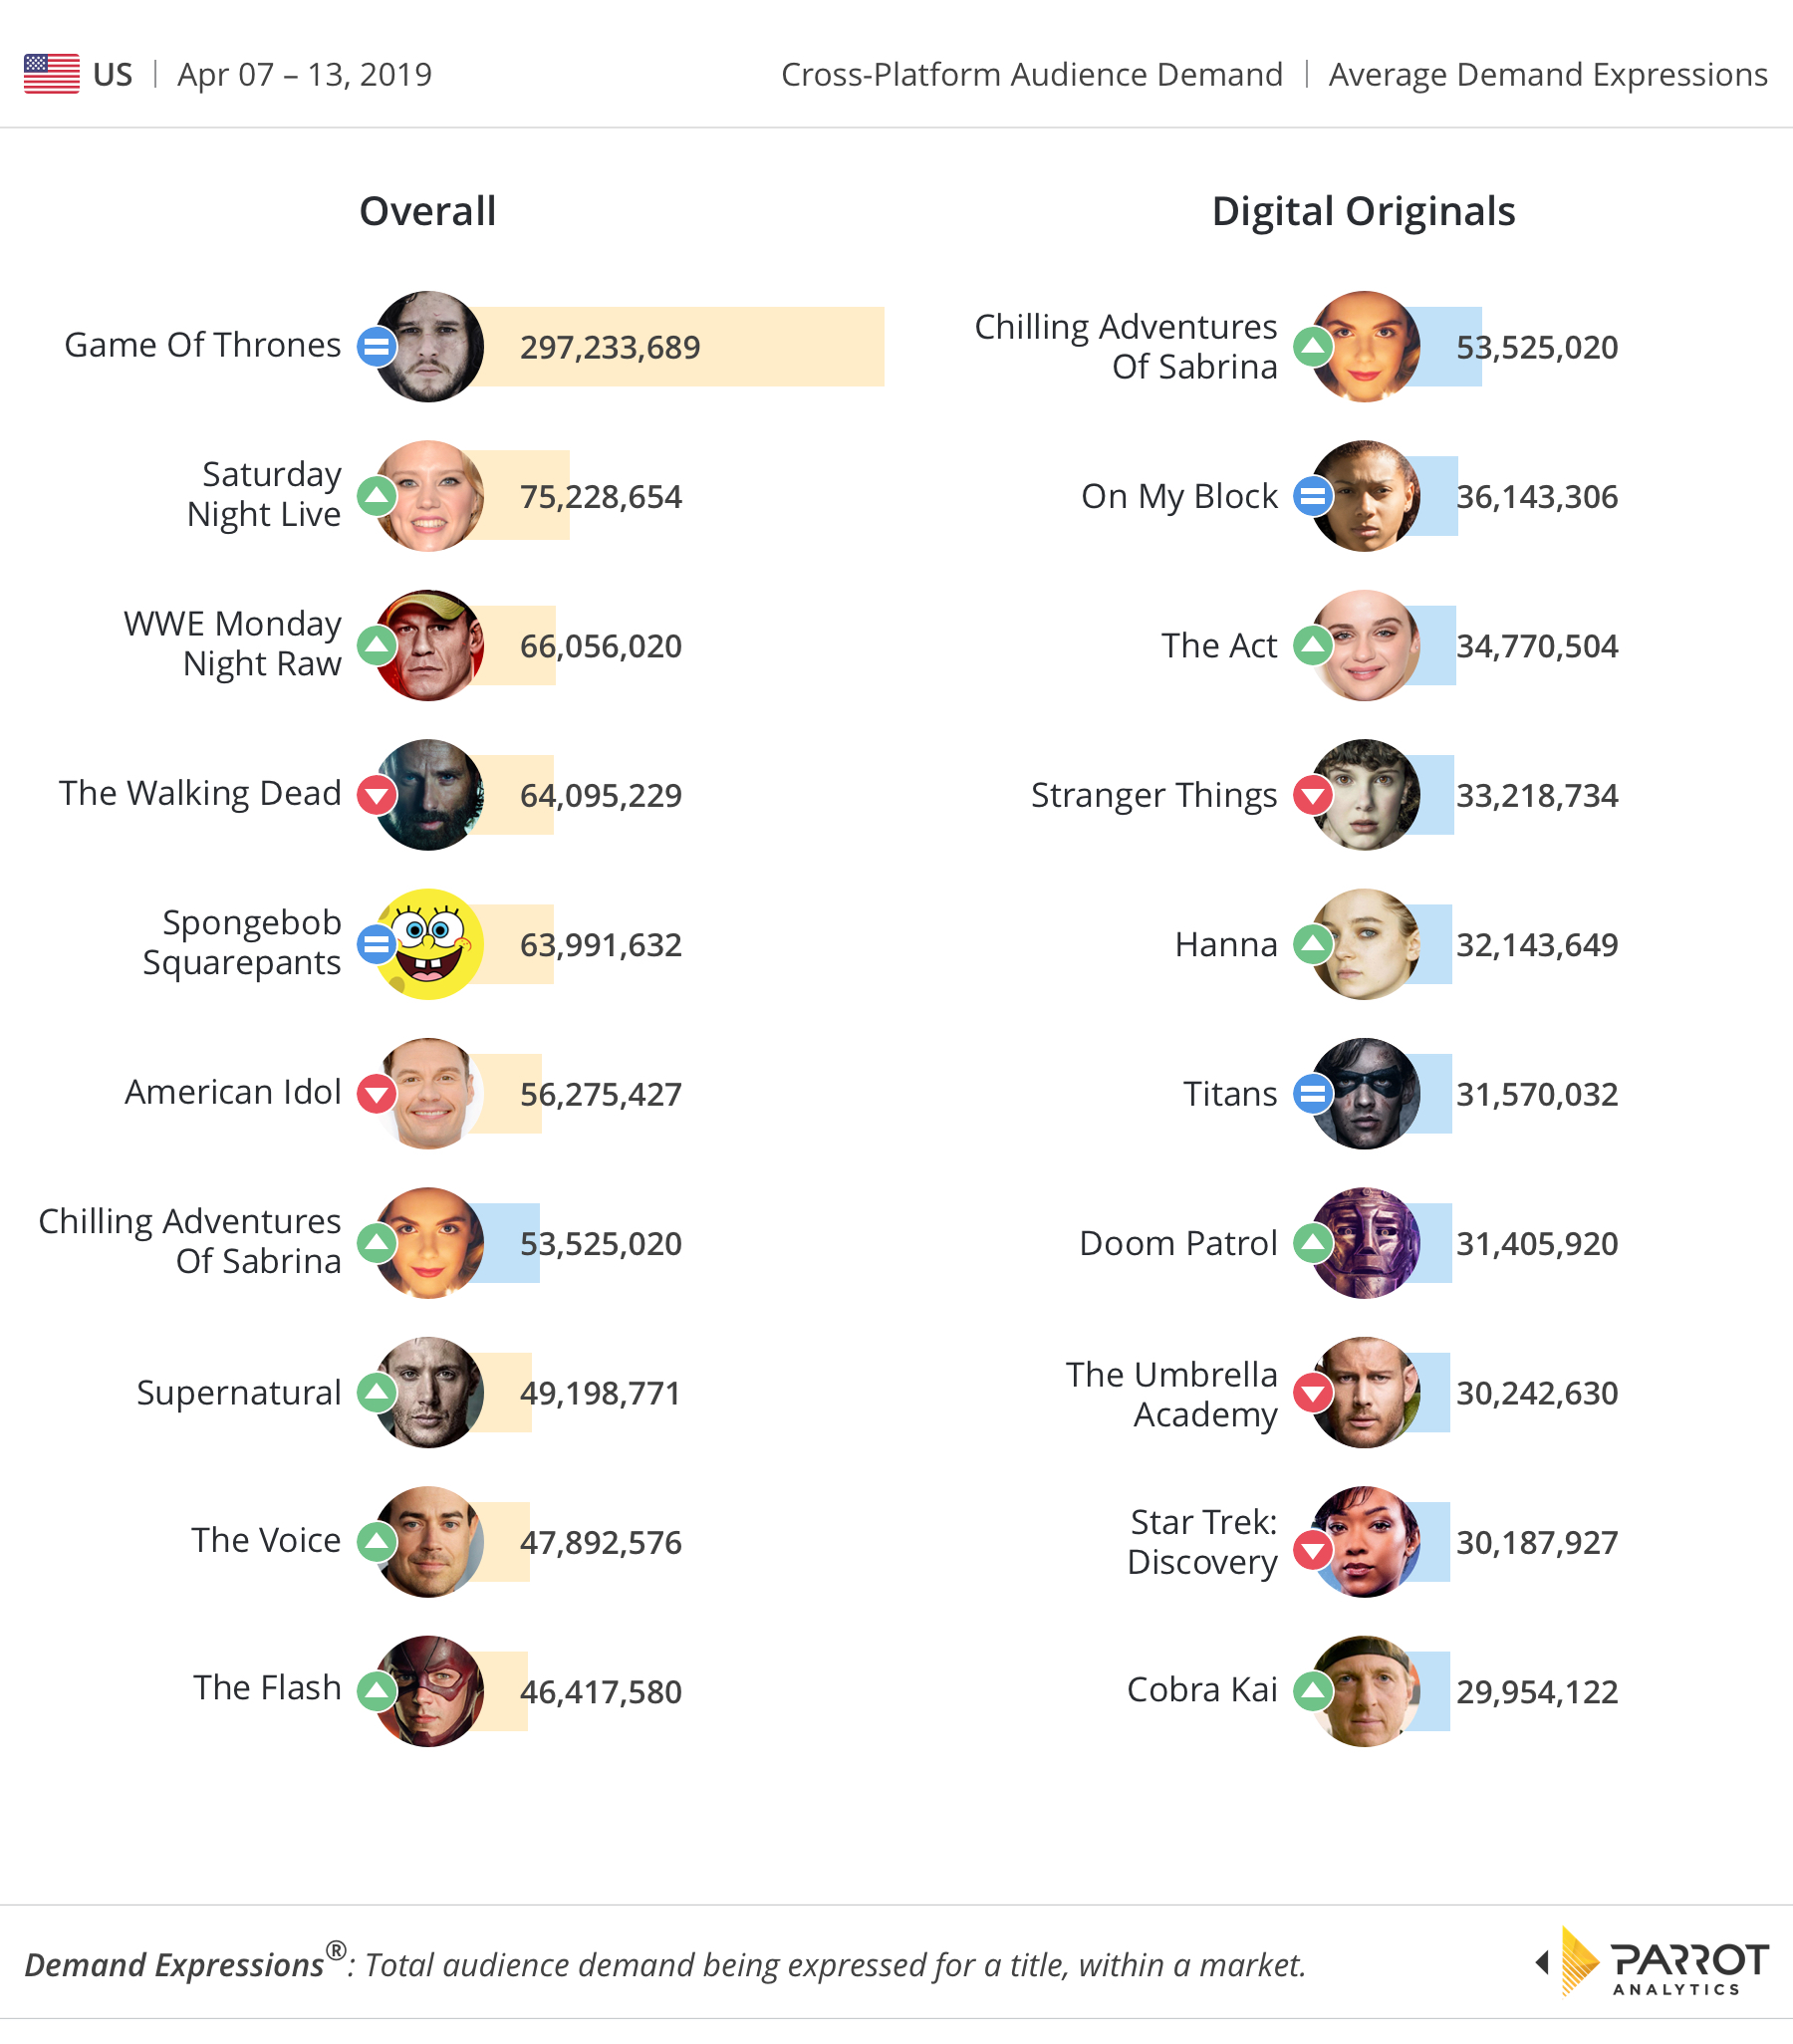
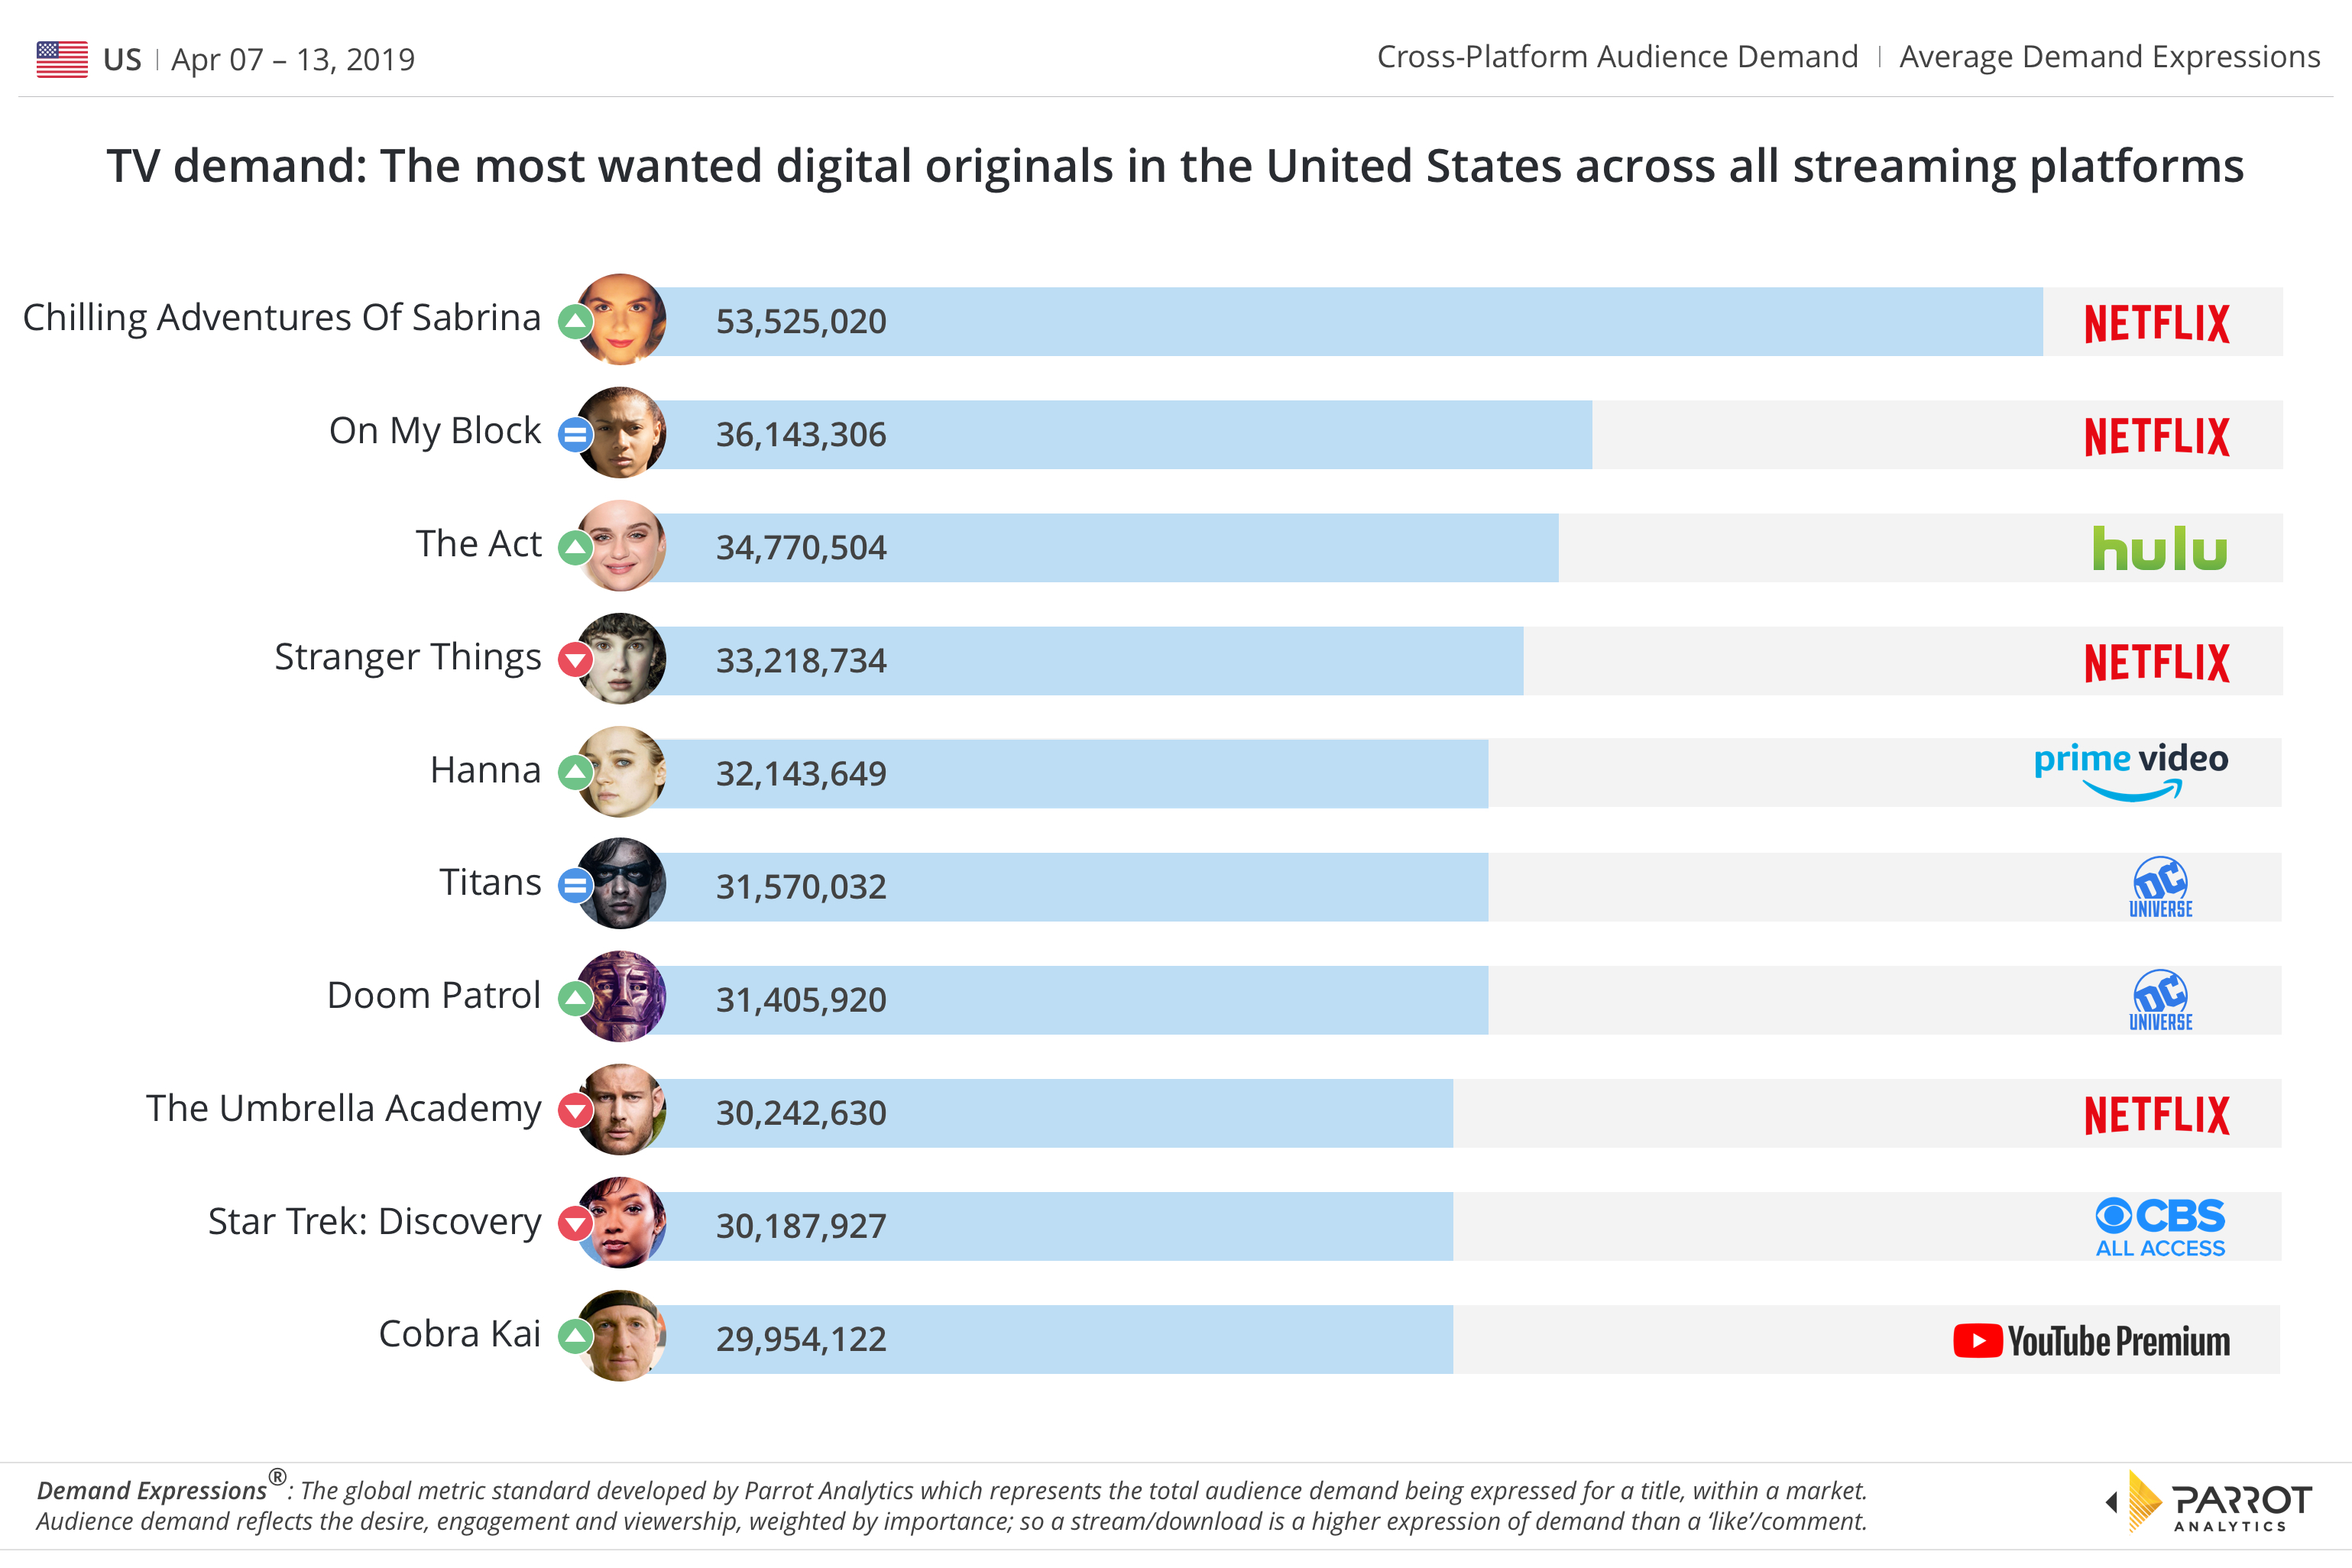
This is an exciting week in television with the final season of HBO’s Game of Thrones having now premiered on April 14th, and the hotly anticipated second part of Chilling Adventures of Sabrina hitting our digital chart at No. 1 for the week ending April 13th. In April as a whole the streamers will keep the content volume “cranked up”, with over 65 new and returning series premiering: A new season of On My Block has already started and it looks like the young-adult series is set to continue to delight fans with demand expected to be high throughout April.
Last December, Netflix renewed Chilling Adventures Of Sabrina for the second season of 16 episodes, which will also be split into two parts. The lower episode count compared to a traditional 22-episode season helps the horror series to streamline its storytelling, with “plot twists” likely having greater impact. In fact, nine of the digital series in this chart have 11 or fewer episodes each (Star Trek: Discovery has 14 episodes), making them easier to binge and follow.
Unsurprisingly, Hanna was renewed for season two by Amazon Prime Video earlier this week; the action-adventure series has done well and this week the series comes in at #5, an increase of 12.9% week-on-week, slightly more demand than the two recent DC Universe streaming series: Titans (-6.2%) and Doom Patrol (+14.1%).
Parrot Analytics has recently taken an in-depth look at the most popular TV series produced by SVOD platforms globally, as well as in the United States, by leveraging Parrot Analytics’ global content analytics capabilities: You can download the free 68-page report here: The Global Television Demand Report. As a a bonus, this report also includes data and analysis for nine other countries as well.
With one more episode left before the events of CBS All Access’ Star Trek: Discovery catch up to the beginning of the original series in the Star Trek timeline, American fans are expressing high demand for the sci-fi canon heading toward its conclusion when the second season finale airs on April 18th. We have also detected a slight bump in demand on the back of the third season being commissioned, along with its confirmed five companion spin-off series.
The return of the YouTube Premium hit show Cobra Kai has surged up our digital chart at No. 10 (+23.8% week-on-week), rounding out this week’s chart as we continue the story of Daniel LaRusso (Ralph Macchio) and Johnny Lawrences (William Zabka). The new season starts on April 24th.
Yes, Winter is indeed coming. The last season of Game of Thrones will bring to an end the story of Jon Snow (Kit Harington), Daenerys Targaryen (Emilia Clarke), Cersei Lannister (Lena Headey) and all their friends and foes. Demand for the epic HBO series has skyrocketed again, this time by 16.6% week-to-week with no sign of slowing down. In the weeks to come we expect Game of Thrones to break the 300 million daily demand barrier in the U.S. alone, as well as dominating television screens in key markets globally.
With the start of spring, various unscripted titles continue their weekly broadcast; among the many series to note is American Idol, well ahead of The Voice. At No.2. Saturday Night Live on the overall chart has gained in demand (5.7%) after the septet pop group BTS became the first Korean group to perform live in Studio 8H on April 13th. Finally, WWE Monday Night Raw (+28%) jumped from No. 6 to No. 3.


