Image: The Man in the High Castle, Amazon Prime Video

Parrot Analytics’ weekly top 10 television charts are based on Demand Expressions, a weighted average empirically-established industry metric that does not include panel-based traditional TV ratings. Instead, our globally standardized demand data incorporates numerous inputs such as peer-to-peer and streaming content data, fan and critic rating data, social media data and many more data sources; 100+ markets are available for analysis using our software-as-a-service TV measurement system based on actual audience activity and behavior. Let us now look at our streaming TV rating chart and linear TV series popularity chart, powered by demand data, for the U.S. domestic market.
The Amazon Prime Video 10-episode third season of The Man in the High Castle debuted at No. 4 this week as a fully realized post-WWII dystopian drama honoring Philip K. Dick’s big theme. Back in July, Amazon Prime revealed that it was renewing the show for a fourth season during the San Diego Comic-Con. This latest third season premiered on October 5th and promptly reappeared in our digital series chart with a 65% increase in demand compared to the prior week. We have seen high fan engagement for this title not at least due to the incredible cinematographer and director Ernest Dickerson, who helmed direct season three of The Man in the High Castle.
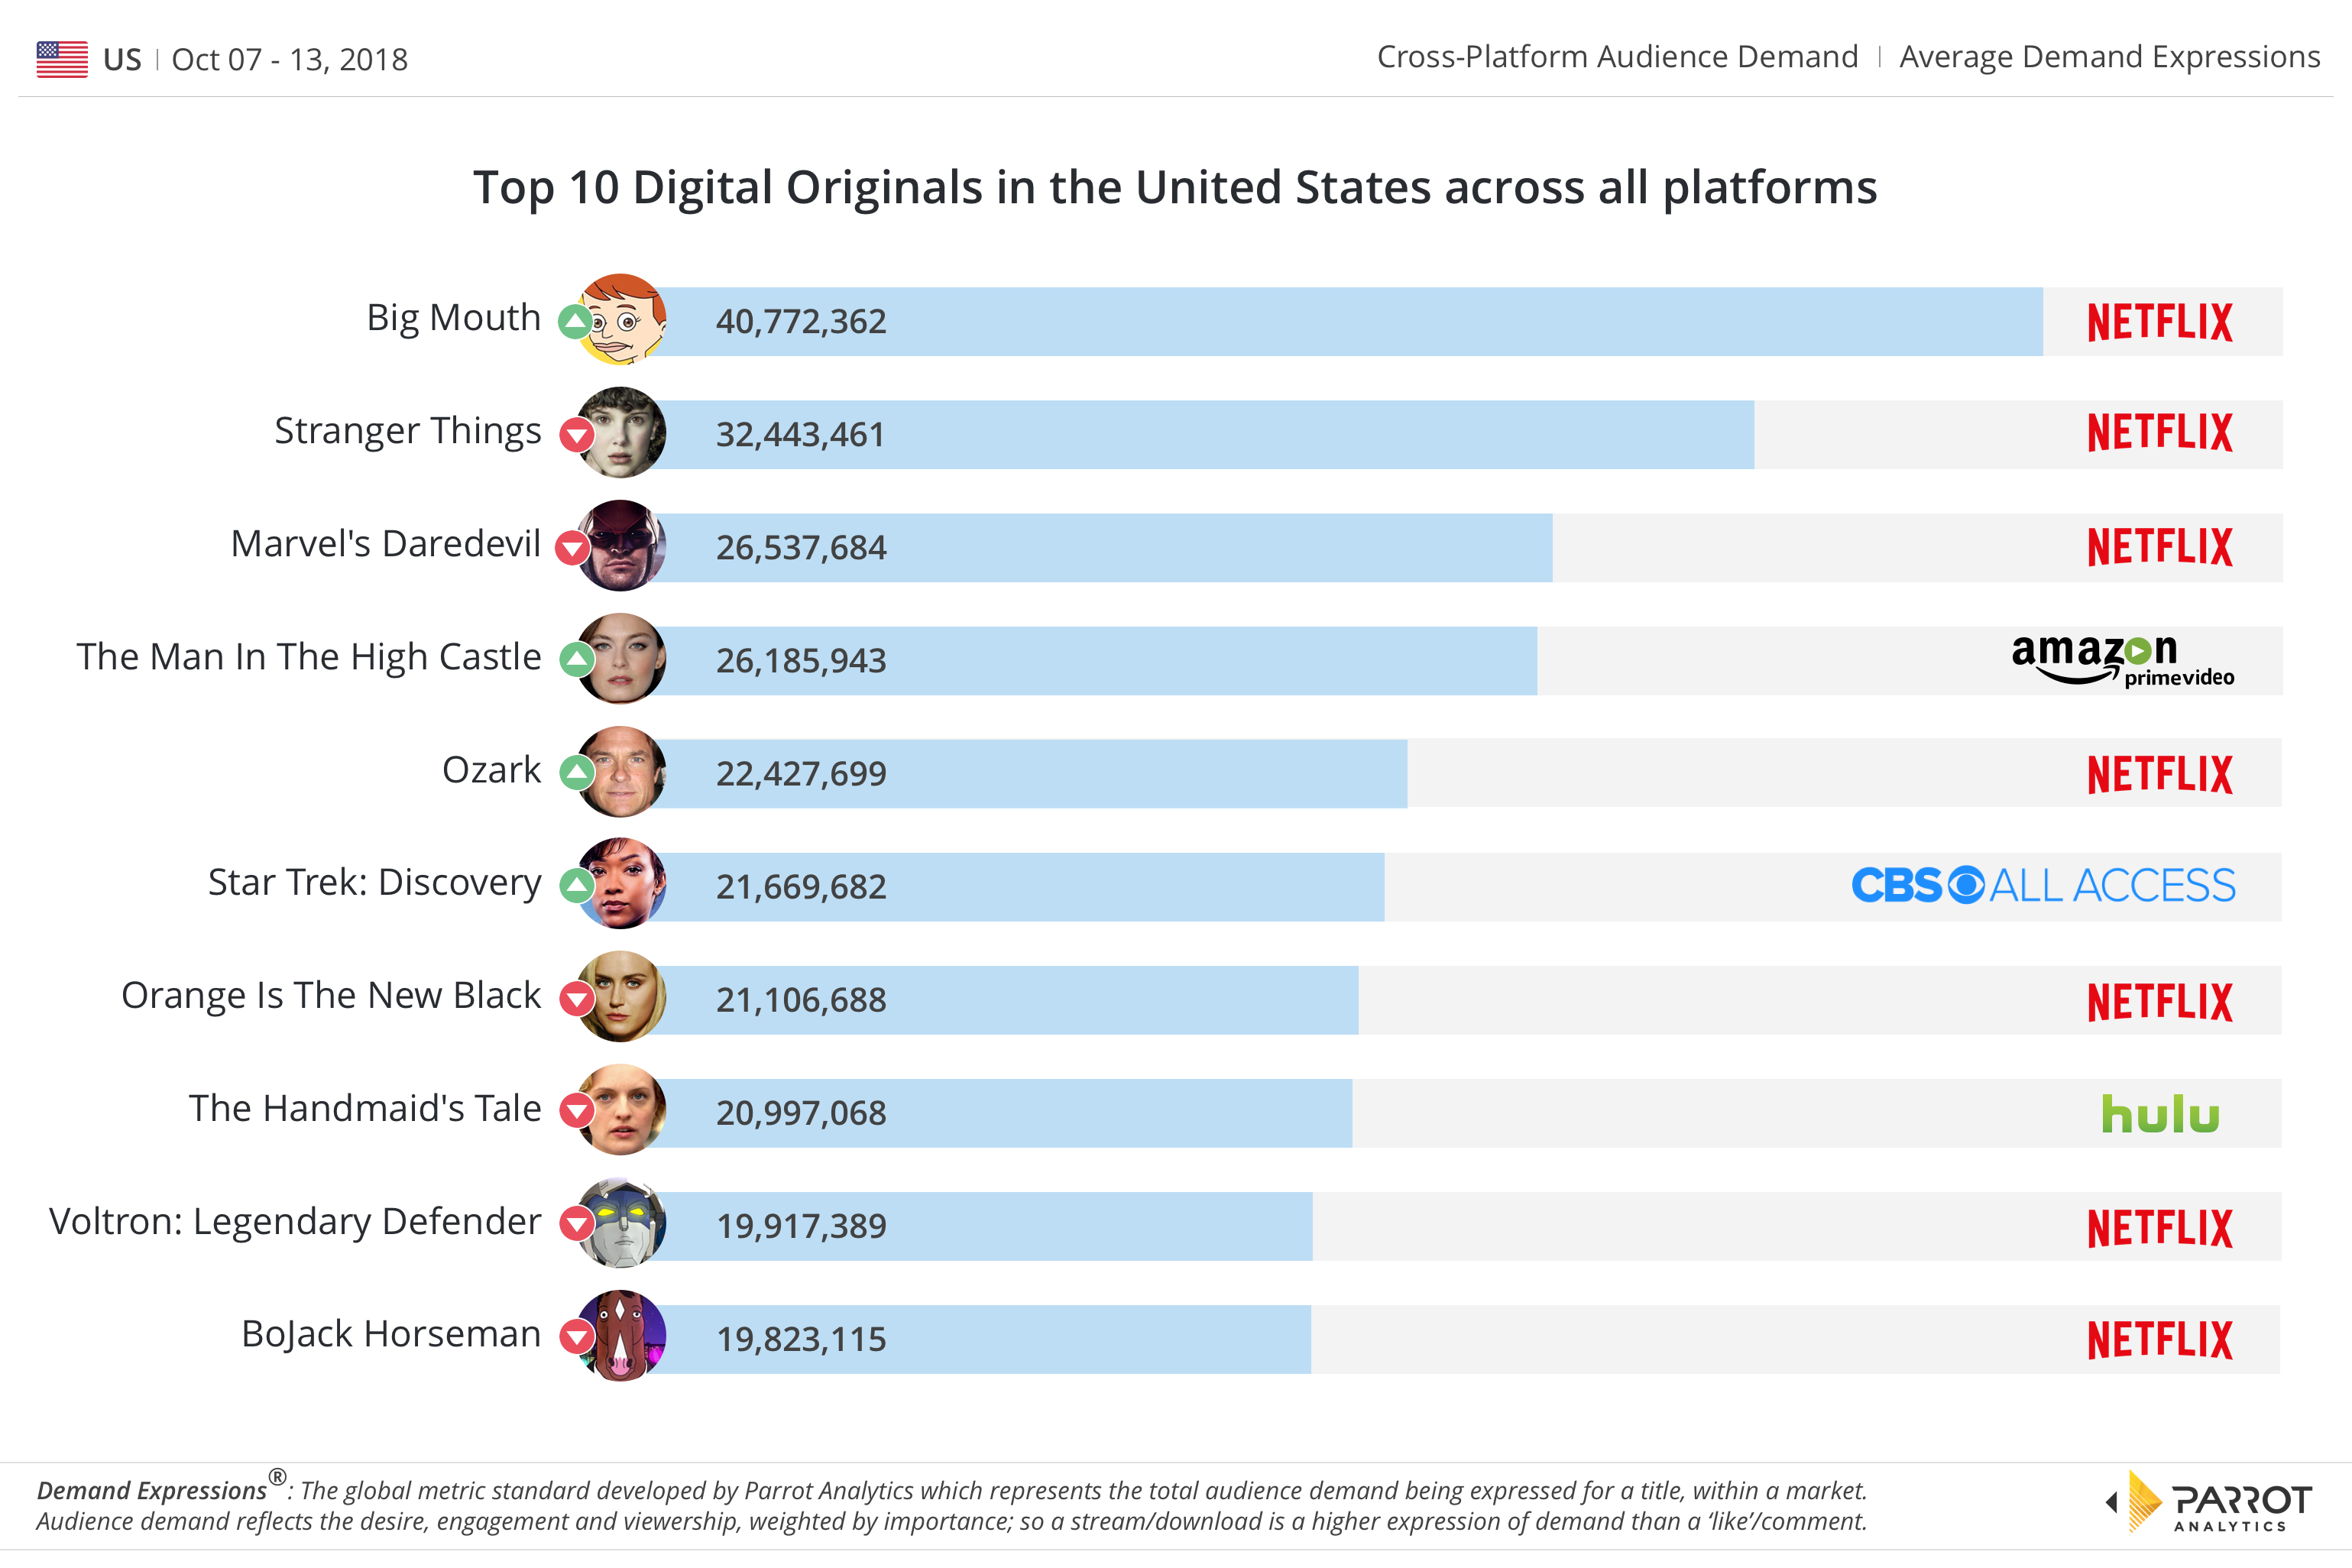
Netflix’s Big Mouth came in at No. 1 this week with 40.7 million average daily Demand Expressions for the week that ended October 13th, according to our latest U.S. television series demand data. The adult animated sitcom enjoyed an almost 3-fold bump in demand compared to the prior week partly due to the release of new episodes that started streaming on October 5th. Big Mouth uses raunchy humor to discuss sensitivity topics, attracting more than twice the demand as 10th placed Bojack Horseman – another adult humor animated series from Netflix.
Elsewhere in the chart, Netflix titles produced steady results: Marvel’s Daredevil gained a single-digit percentage improvement in demand (+4%) compared to last week as audience anticipation for season 3 is building. And demand for Ozark rose by a similar degree compared to the prior week (+6%) on the news that Netflix has commissioned season three.
This week, season premieres have impacted on demand on the overall chart: BBC’s Doctor Who (ranked No. 4; the longest-running science-fiction series with 1100+ aired episodes), CW’s The Flash (previously ranked No. 6), CW’s Supernatural (ranked No. 9), and CW’s Riverdale (a 71% increase in demand compared to last week) all experienced a surge in demand after each respective series premiered this month. And for the first time in months, AMC’s The Walking Dead is once again back in pole position as the most in-demand title on the overall chart, with 10% more demand compared to FX’s American Horror Story.
For more information, reach out to Parrot Analytics for a live demonstration of our Demand Portal, or watch our latest product video.
The data in this article are based on Demand Expressions (DEX). DEX is the globally standardized TV measurement metric developed by Parrot Analytics, which represents the total audience demand being expressed for a title, within a market. Audience demand reflects the desire, engagement and viewership, weighted by importance; so a stream/download is a higher expression of demand than a ‘like’/comment.

