Image: Insatiable, Netflix
Parrot Analytics’ VOD TV measurement is based on Demand Expressions, the only global industry standard metric, which captures the popularity of TV content across all platforms and markets. In this article, we investigate which streaming TV series, as well as Pay-TV, broadcast, and linear TV series, are currently the most in-demand in the American domestic market. As each week, our charts are powered by Parrot Analytics global TV demand data.
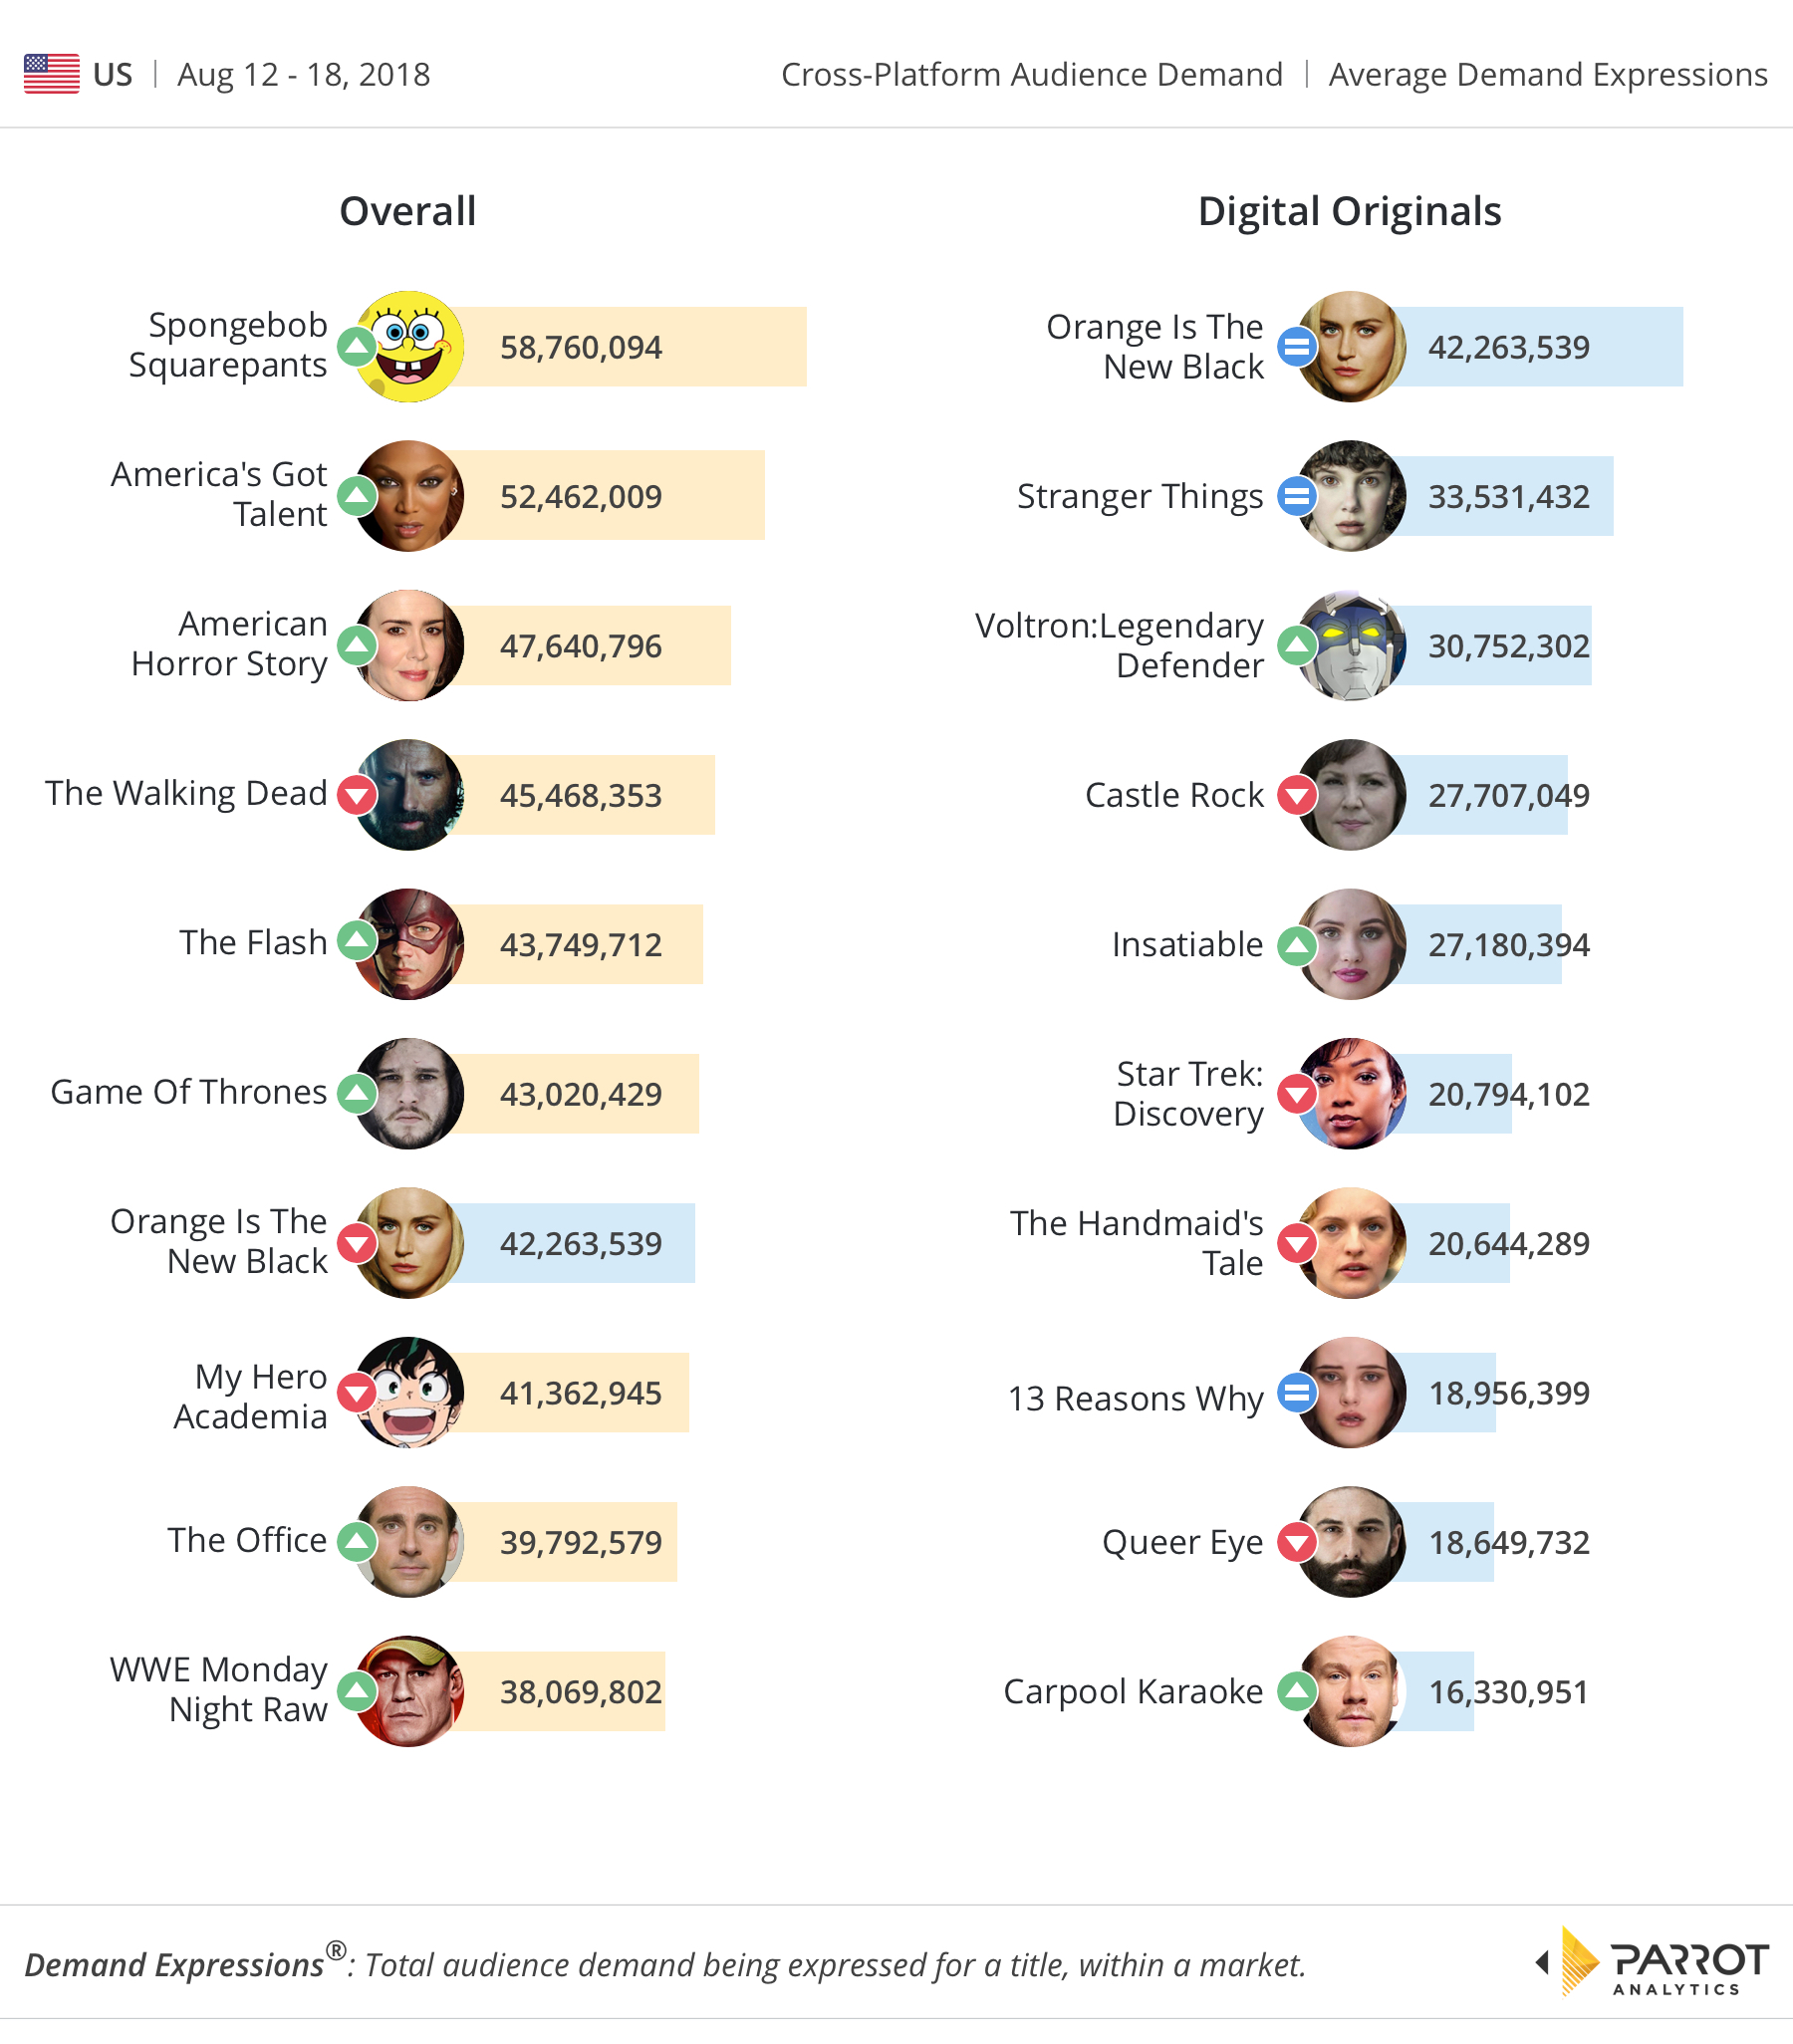
This week, the top two rankings on the digital original charts are the same as the previous week, headlined by Orange is the New Black, which is averaging 42.2 million daily Demand Expressions, placing it far ahead of Stranger Things. Demand for Orange is the New Black fell 20% compared to the prior week while Stranger Things, which is on hiatus, gained 16%.
A new entry on the American digital originals chart is Netflix’s Insatiable with a 67% demand increase compared to the previous week. The controversial series has been labeled “fat shaming” while others have said it’s yet another series that misunderstands teenagers. For more details about demand for controversial series, read this article by Parrot Analytics’ Insights Director Karina Dixon here.
The perennially popular Netflix digital original series Queer Eye and Voltron: Legendary Defender both changed in rank from the prior week, with Queer Eye moving down to No. 9 from No. 6 with a slight drop in demand. With the exception of two Hulu titles, Star Trek: Discovery from CBS All Access and Apple Music’s Carpool Karaoke, the top 10 chart for the week August 12-18 was dominated by Netflix.
The ever-popular Spongebob Squarepants has returned to the top of the overall charts in the U.S. as viewers continued to engage with season 11. The children’s series experienced a 16% rise in Demand Expressions from the prior week, moving up from the No. 2 spot. Meanwhile, The Office and WWE Monday Night Raw are both new on the U.S. chart this week.
For more information about television measurement across all platforms and devices reach out to Parrot Analytics for a live demonstration of our Demand Portal, or watch our latest product video.

