Image: Killing Eve, BBC America
Parrot Analytics’ demand measurement platform provides insight into global, country-specific audience demand for television content, including audience OTT demand – demand for episodic TV content on OTT and SVOD platforms. TV demand reflects the desire, engagement and viewership of content and is weighted by importance; so a stream/download is a higher expression of demand than a “like” or a comment. As usual, let us now take a look at top shows in the United States, powered by Parrot Analytics’ U.S. TV demand data.
After HBO’s Game of Thrones dominated the better part of April and May, many linear networks and streamers have stacked up on June premieres. Netflix, for example, will release 57 new and returning series – bringing binge-worthy shows and incredible genres for seemingly every possible interest.
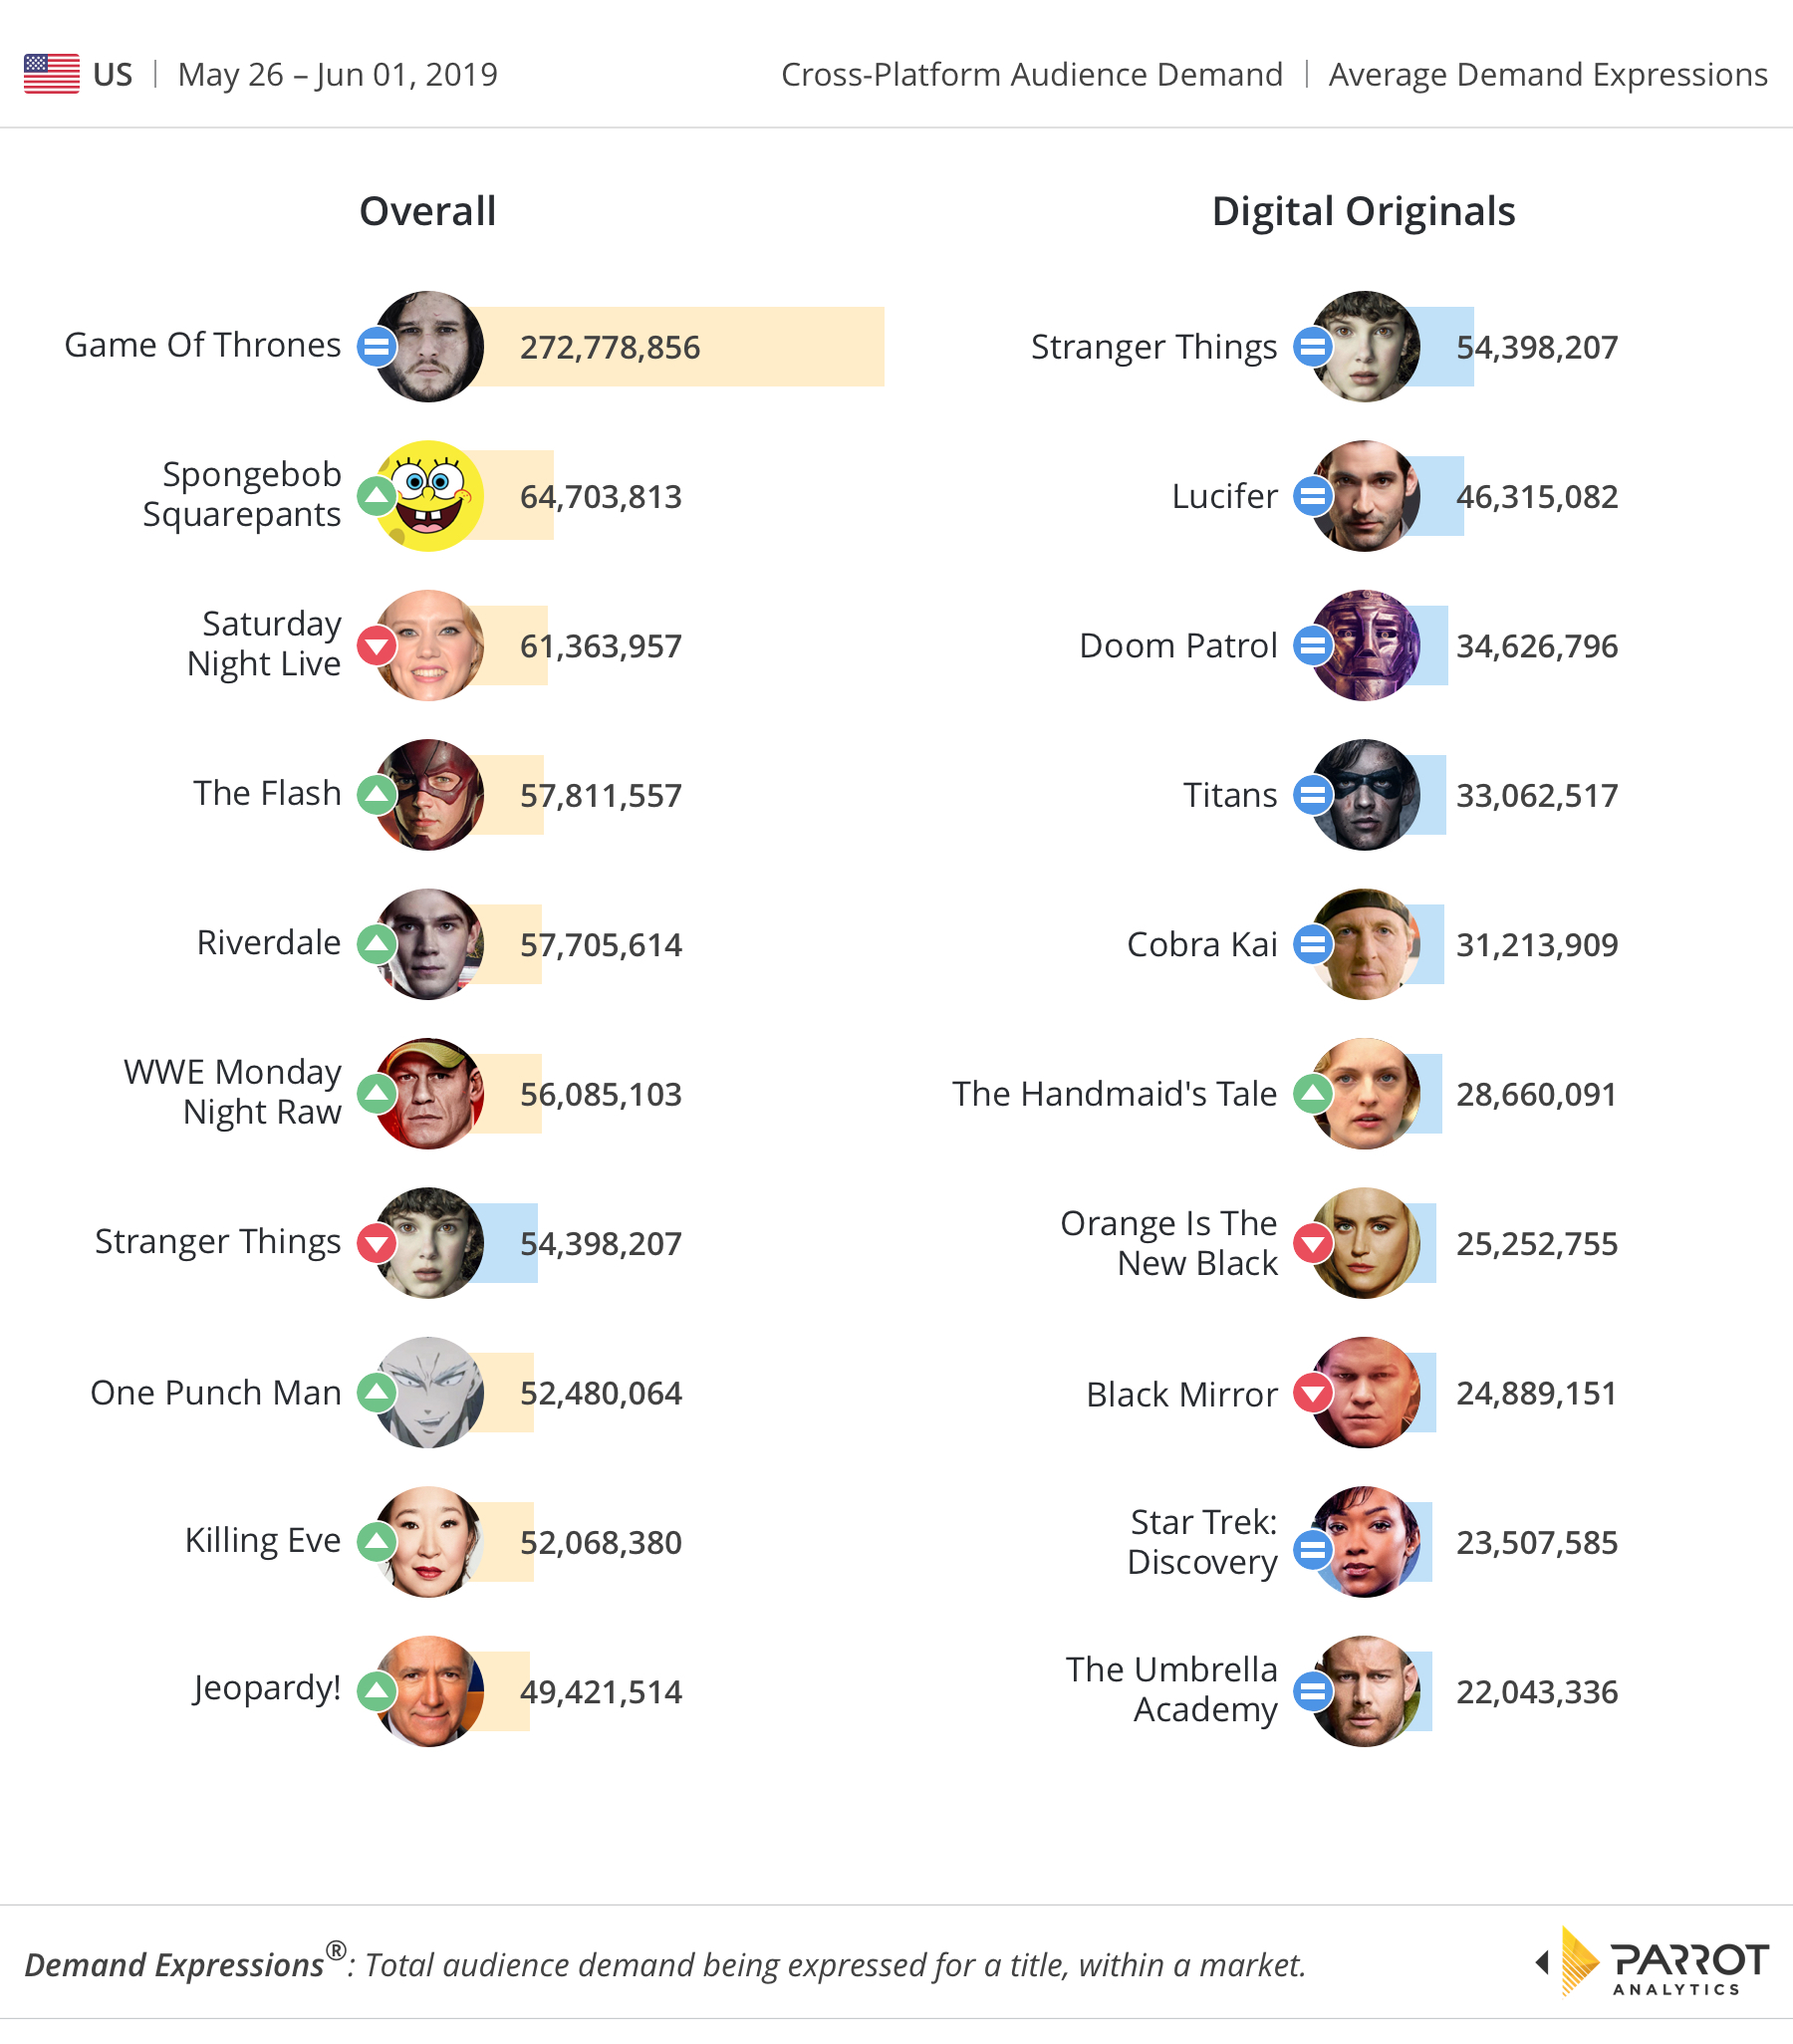
As spring turns into summer, we see audience demand stabilize in the American digital chart with no changes in the top ranks compared to last week. While Netflix titles occupied five out of ten rankings in this week’s digital chart, we saw other streaming platforms like D.C. Universe, YouTube Premium, Hulu and CBS All Access all thriving in the ever-growing streaming market.
The third series of Stranger Things is arriving in 1 month’s time, which means marketing has been in overdrive, including making some of the real-world locations into replicas of fictional spaces: Audiences want to inhabit the fiction, to hang out with Eleven and even eat the same food she is eating.
There appears to be a current fascination with creating uncanny, hyper-real liminal spaces that break down the boundaries between fiction and reality; for one of many examples, take the Stranger Things inspired ice cream flavors at U.S. restaurant chain Baskin Robbins. With 54.3 million in daily demand, Netflix’s Stranger Things is ranked first currently, ahead of another Netflix show, Lucifer.
Cobra Kai from YouTube Premium had slightly more demand compared to The Handmaid’s Tale even though both titles are currently on hiatus. YouTube said last year that its original video programs, including Cobra Kai and other shows, will no longer just be reserved for premium subscribers, starting end of August 2019. Also, the third installment of the hit Hulu drama appears to show handmaids, wives, and Marthas uniting against the brutal military dictatorship. The Handmaid’s Tale drove 39.7 million in daily demand for its last July finale and numbers will not likely disappoint when the third season launches this week.
Elsewhere, ever since WWE made Monday Night RAW a weekly three-hour show in 2012, American fans have debated the merits of their favorite wrestlers on the WWE’s flagship show. RAW‘s latest episode drew in approximately 56 million in daily demand, increasing 86 percent compared to last year’s Memorial Day episode which generated a 30 million in daily demand. Meanwhile demand for Game of Thrones has roughly halved week-on-week.
Lastly, let us offer some quick “Cliff Notes” for some of the more niche titles: The last batch of episodes for One Punch Man (ranked #8) has captured audience interest with the “Monster Association” hitting Saitama and company hard in this second season; One Punch Man streams weekly on Hulu. Lastly, according to NY Post, a video clip appearing to show “Jeopardy!” phenom James Holzhauer’s historic run come to an end made the rounds on social media on Sunday. Jeopardy! is the only title that has experienced double-digit weekly growth compared to all other titles in our chart this week.


