Image: Disenchantment, Netflix
As demand for OTT data increases, specifically with respect to how popular TV series are across all platforms and devices on a worldwide scale, traditional television networks cannot afford to be complacent. Parrot Analytics’ global demand measurement platform can help both linear and non-linear (OTT/SVOD) service providers gain the upper hand in the new competitive economy. By providing globally standardized TV series measurement data, the right content can now be acquired for the right price, sold more strategically, programmed better and monetized more effectively across all TV series consumption platforms (including Twitch, no less).
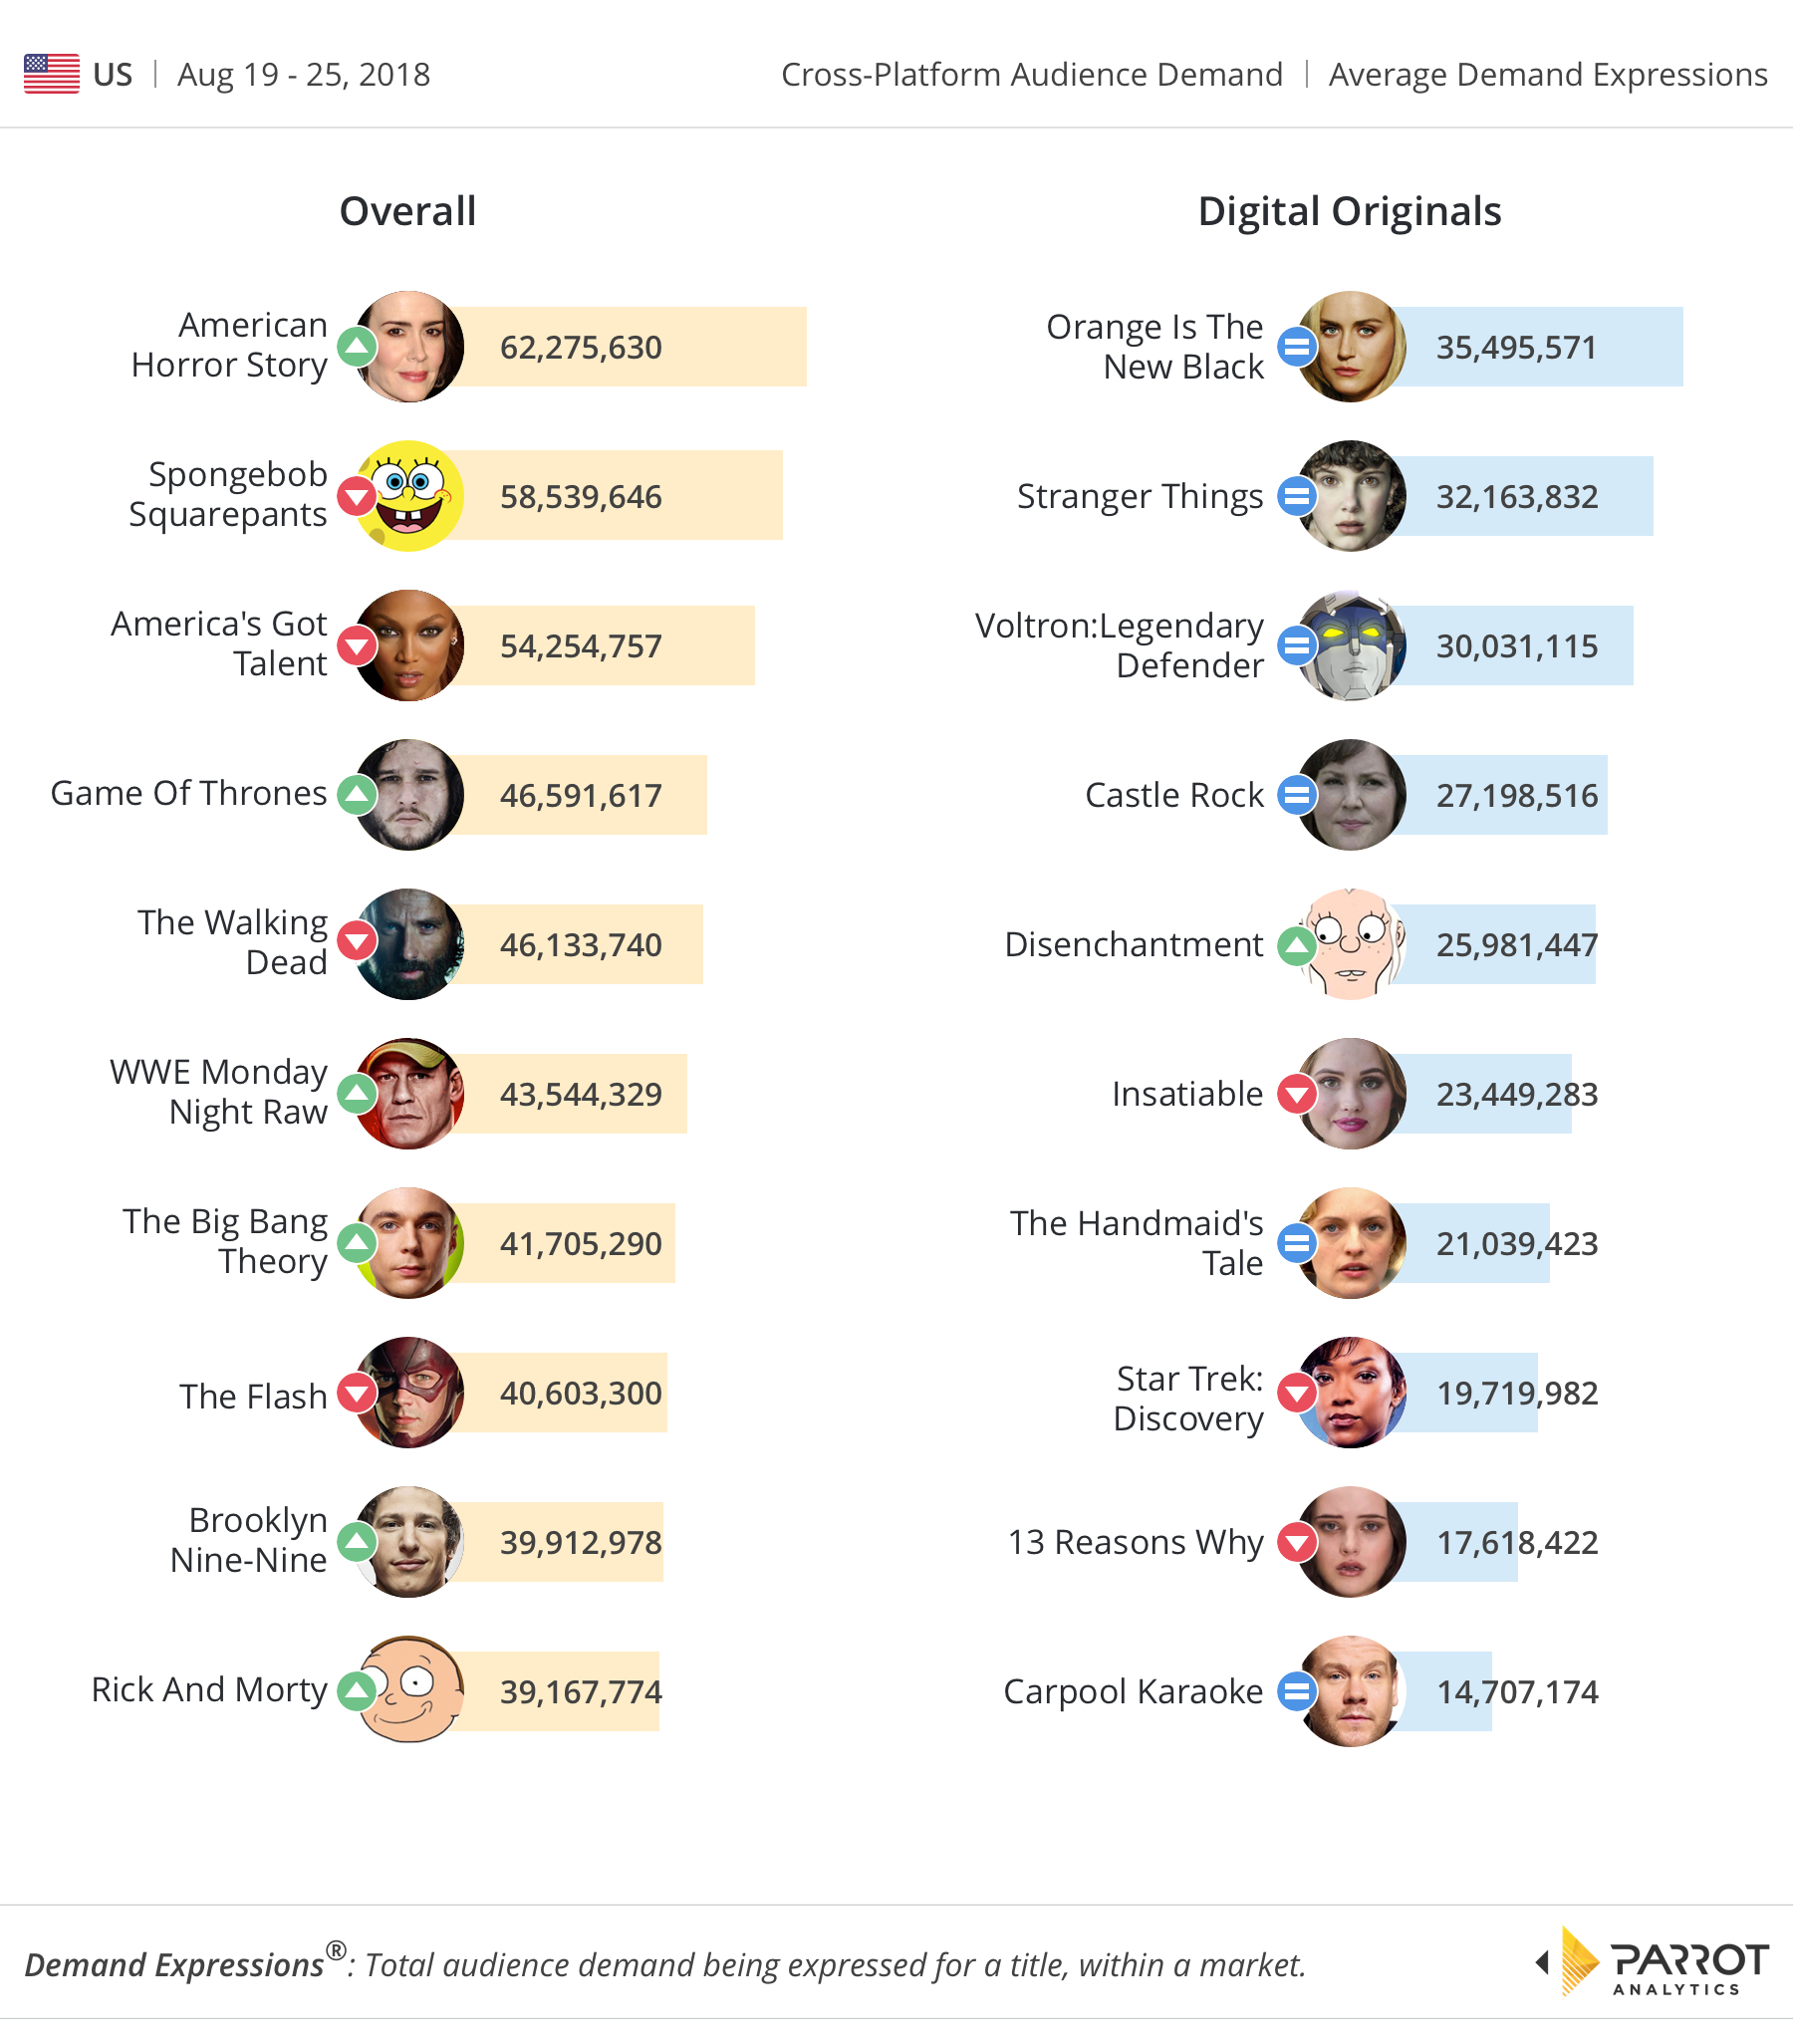
In this week’s demand chart for the U.S. domestic market, there are few changes for the top four digital series, with only one new release this week making into the top 10. First off, Orange is the New Black continues the trend as the most in-demand series in the United States for the week ending August 25, this despite a 16% drop in demand from the prior week. The Netflix drama has now held the #1 ranking for four consecutive weeks.
A new entry this week is Netflix’s Disenchantment with a three-fold demand increase compared to the previous week. Disenchantment (previously ranked #25) is created by The Simpsons’ creator Matt Groening, and is the streaming service’s sixth animation series for adults. Audience expectation are high for this series and it is likely that Disenchantment will continue to feature on the U.S. chart for weeks to come given the genre, or perhaps this series’s demand will drop like that of other digital originals: A sharp peak followed by an equally-sharp drop in demand.
Rounding out at #10, Carpool Karaoke from Apple Music stood out on the digital series charts with the same ranking compared to the prior week despite the streaming series (which is adapted for Apple Music subscribers) still being on hiatus since June.
Most of the series in the overall chart are on summer hiatus: There were 62.2 million Demand Expressions for American Horror Story this week, which is starting its eighth season soon, topping the overall chart after a 30% uptick in demand compared to last week. The others were Spongebob Squarepants with over 58.5 million Demand Expressions, followed by America’s Got Talent ahead of the fourth-ranking title Game of Thrones. We also picked up a significant increase in demand from The Big Bang Theory (+81.7%) likely relating to the announcement that the show is ending in 2019, after 12 seasons. Elsewhere, Brooklyn Nine-Nine moved to #9 from #11 on the overall chart with a slight rise in demand.
For more information reach out to Parrot Analytics for a live demonstration our Demand Portal, or watch our latest product video.

