Image: Steven Universe, Cartoon Network
Parrot Analytics’ television consumption ratings available for 100+ markets are generated from our sophisticated worldwide measurement system based on global audience activity; the weighted global consumer activities resulting in the worldwide demand for television content.
We do not carry out any consumer surveys to generate our country-specific and global TV demand data. Instead, we capture and measure what audiences actually do: They watch TV shows, read about TV shows, write about TV shows, download TV shows, stream TV shows and share and like information related to TV shows. We then weigh up all these audience interactions such that consumption behaviors are weighted more favorably than, say, a simple “like” on social media.
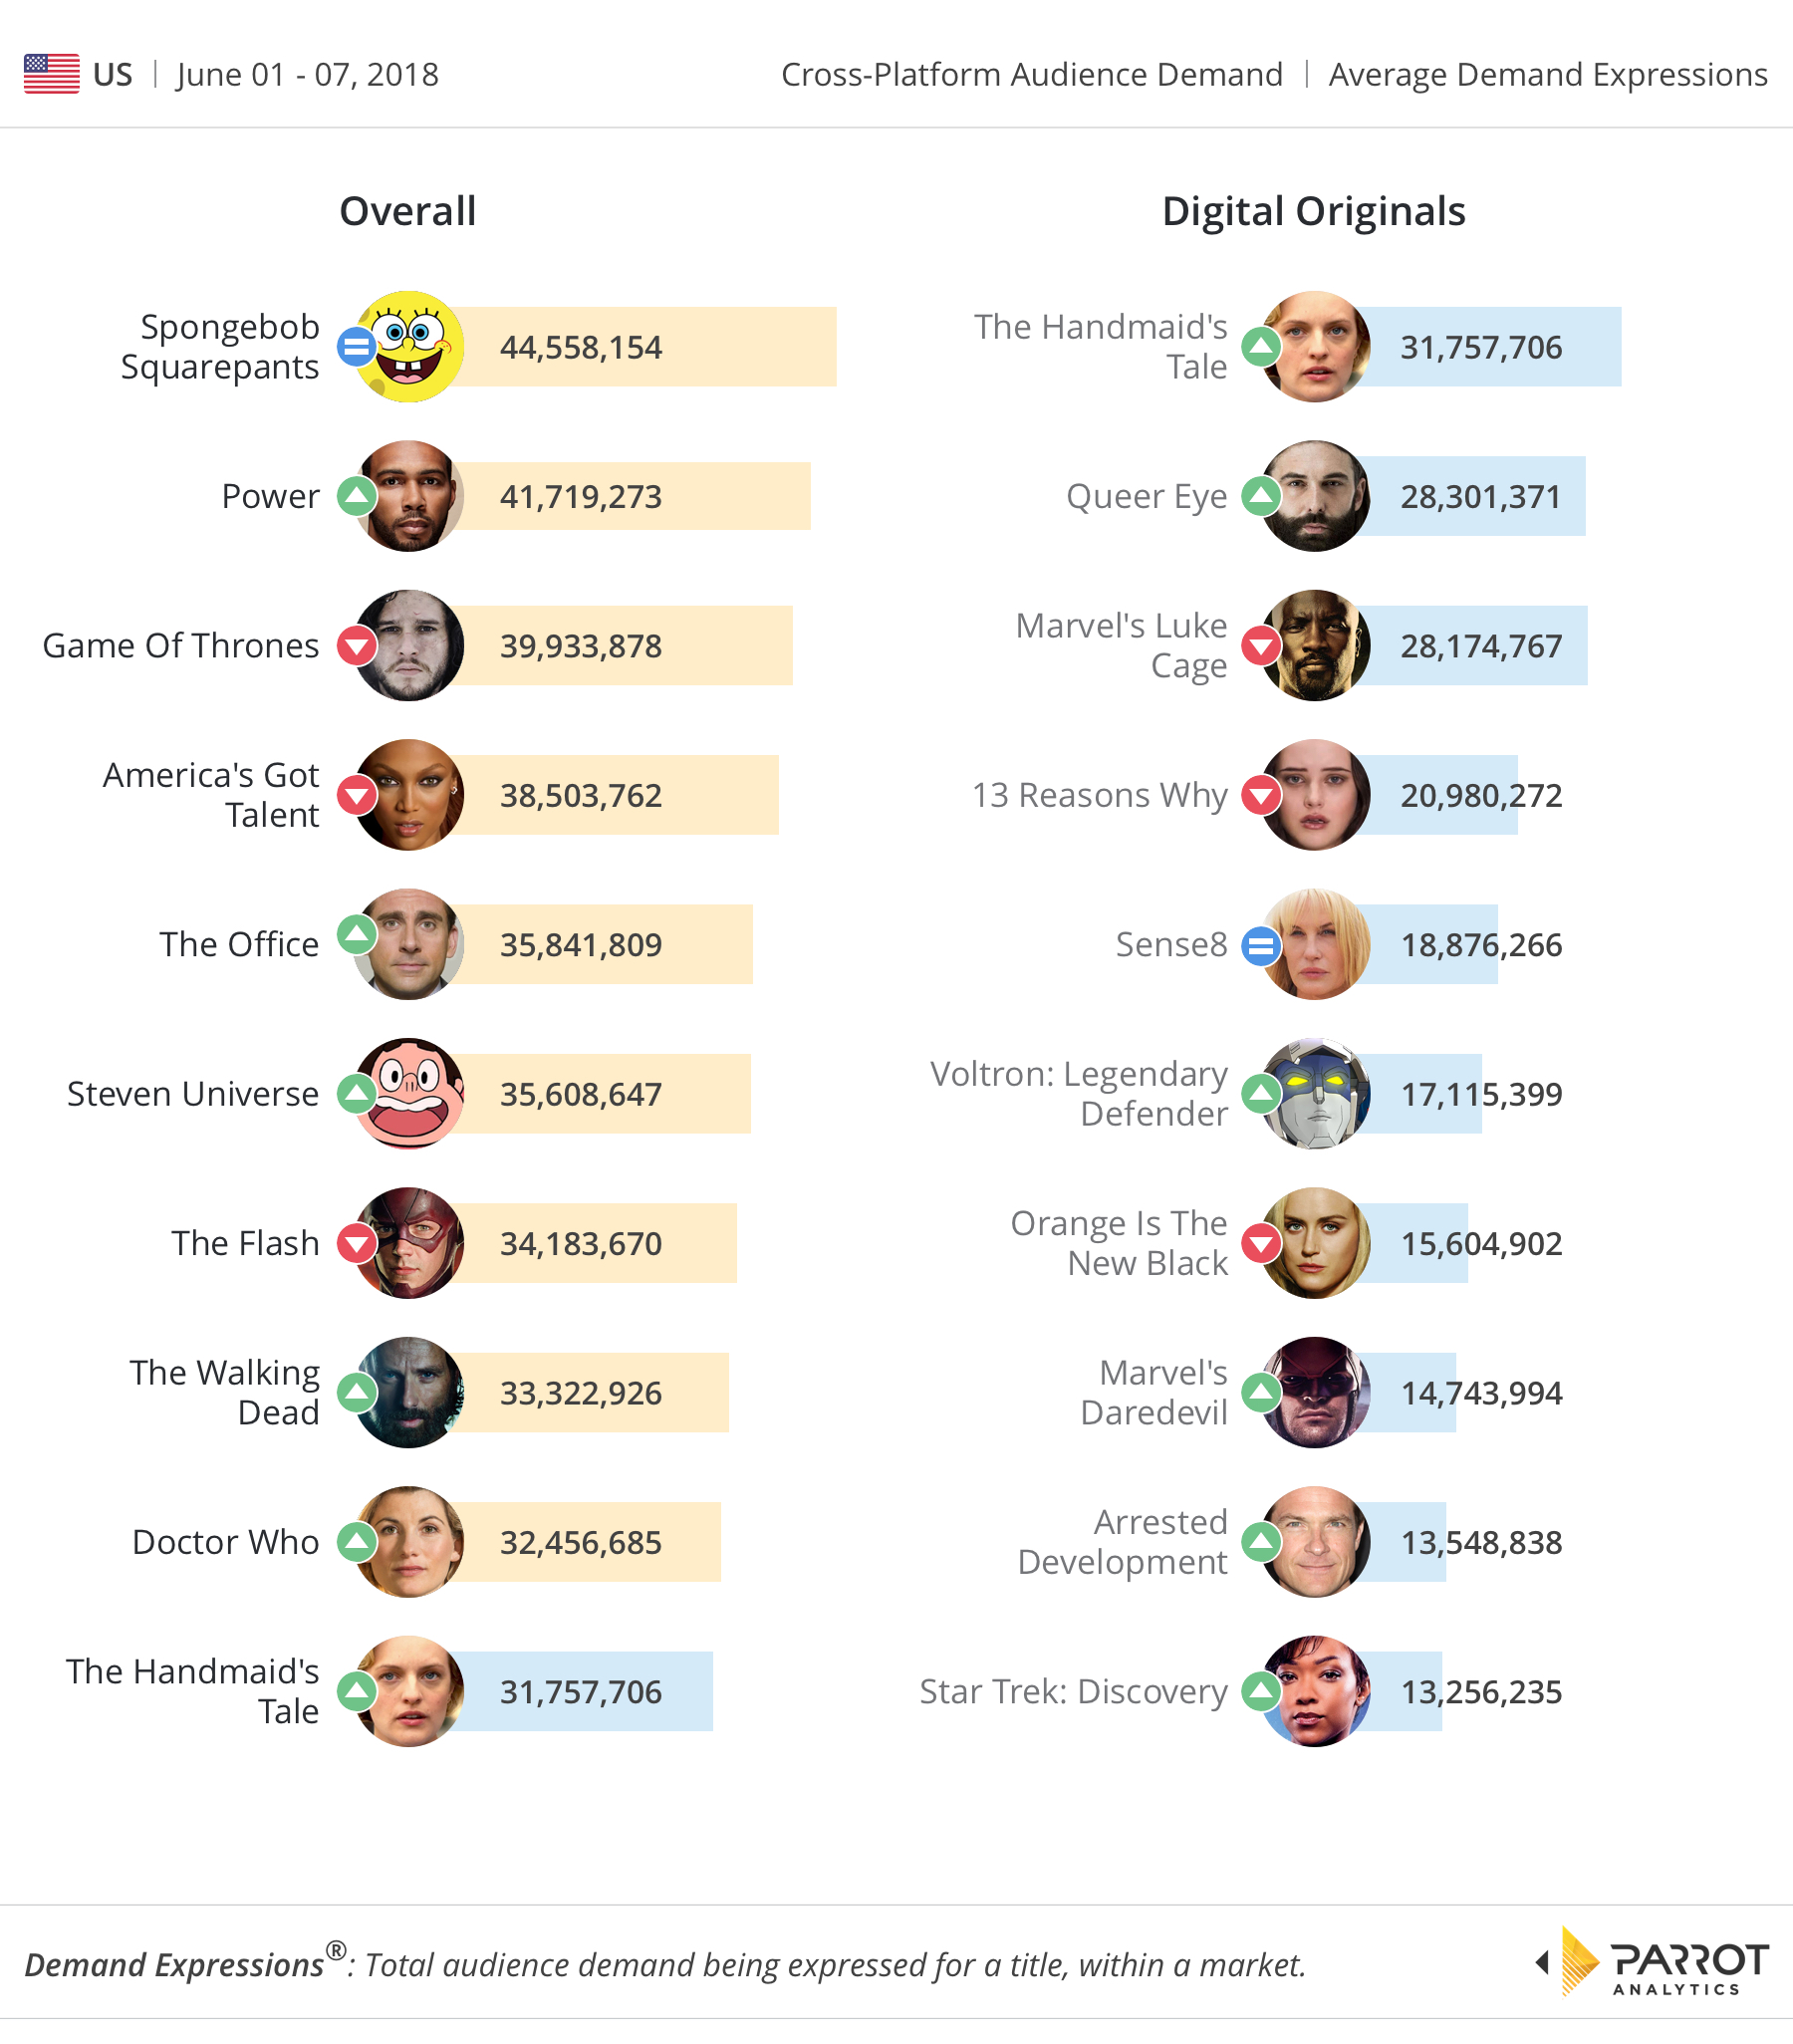
Let us now look at our streaming TV rating chart and linear TV series popularity chart, powered by demand data, for the U.S. domestic market. Our television consumption ratings show that whilst no new releases have entered the charts this week, we do see that the demand for hit series has experienced some fluctuations. As we head into an explosive finale on July 11, The Handmaid’s Tale has generated the highest demand of its entire second season with over 30 million daily average Demand Expressions. Demand for the Hulu series has increased slightly compared to last week (+8%). Another hit series Queer Eye, in the first two weeks after its second season release, has jumped from its fourth ranking the prior week to become the second-most popular digital original this week.
While newly released titles in the last month comprise half of the top digital originals chart, the other half are still hit series in their own right: Sense8, despite the final season and episode now having been aired, had only 11% less demand than Netflix’s super-popular 13 Reasons Why. Elsewhere, the oldest show on the list, Orange is the New Black, is still going strong: It managed to generate 17.2% more demand than the 2017 hottest show, Star Trek: Discovery.
Cartoon Network’s Steven Universe returned to the overall chart as the sixth most in-demand title this week. Bringing long-running stories to a satisfactory conclusion is already hard for series with 42-minute episodes; it is even harder with 11-minute episodes. Finally, many of the other top ten shows have decreased in demand slightly, whilst the long-running but not currently airing The Office has broken into the top ten chart for the first time.
For more information about global television trends, reach out to Parrot Analytics for a live demonstration our Demand Portal, or watch our latest product video.

