Image: The Haunting of Hill House, Netflix
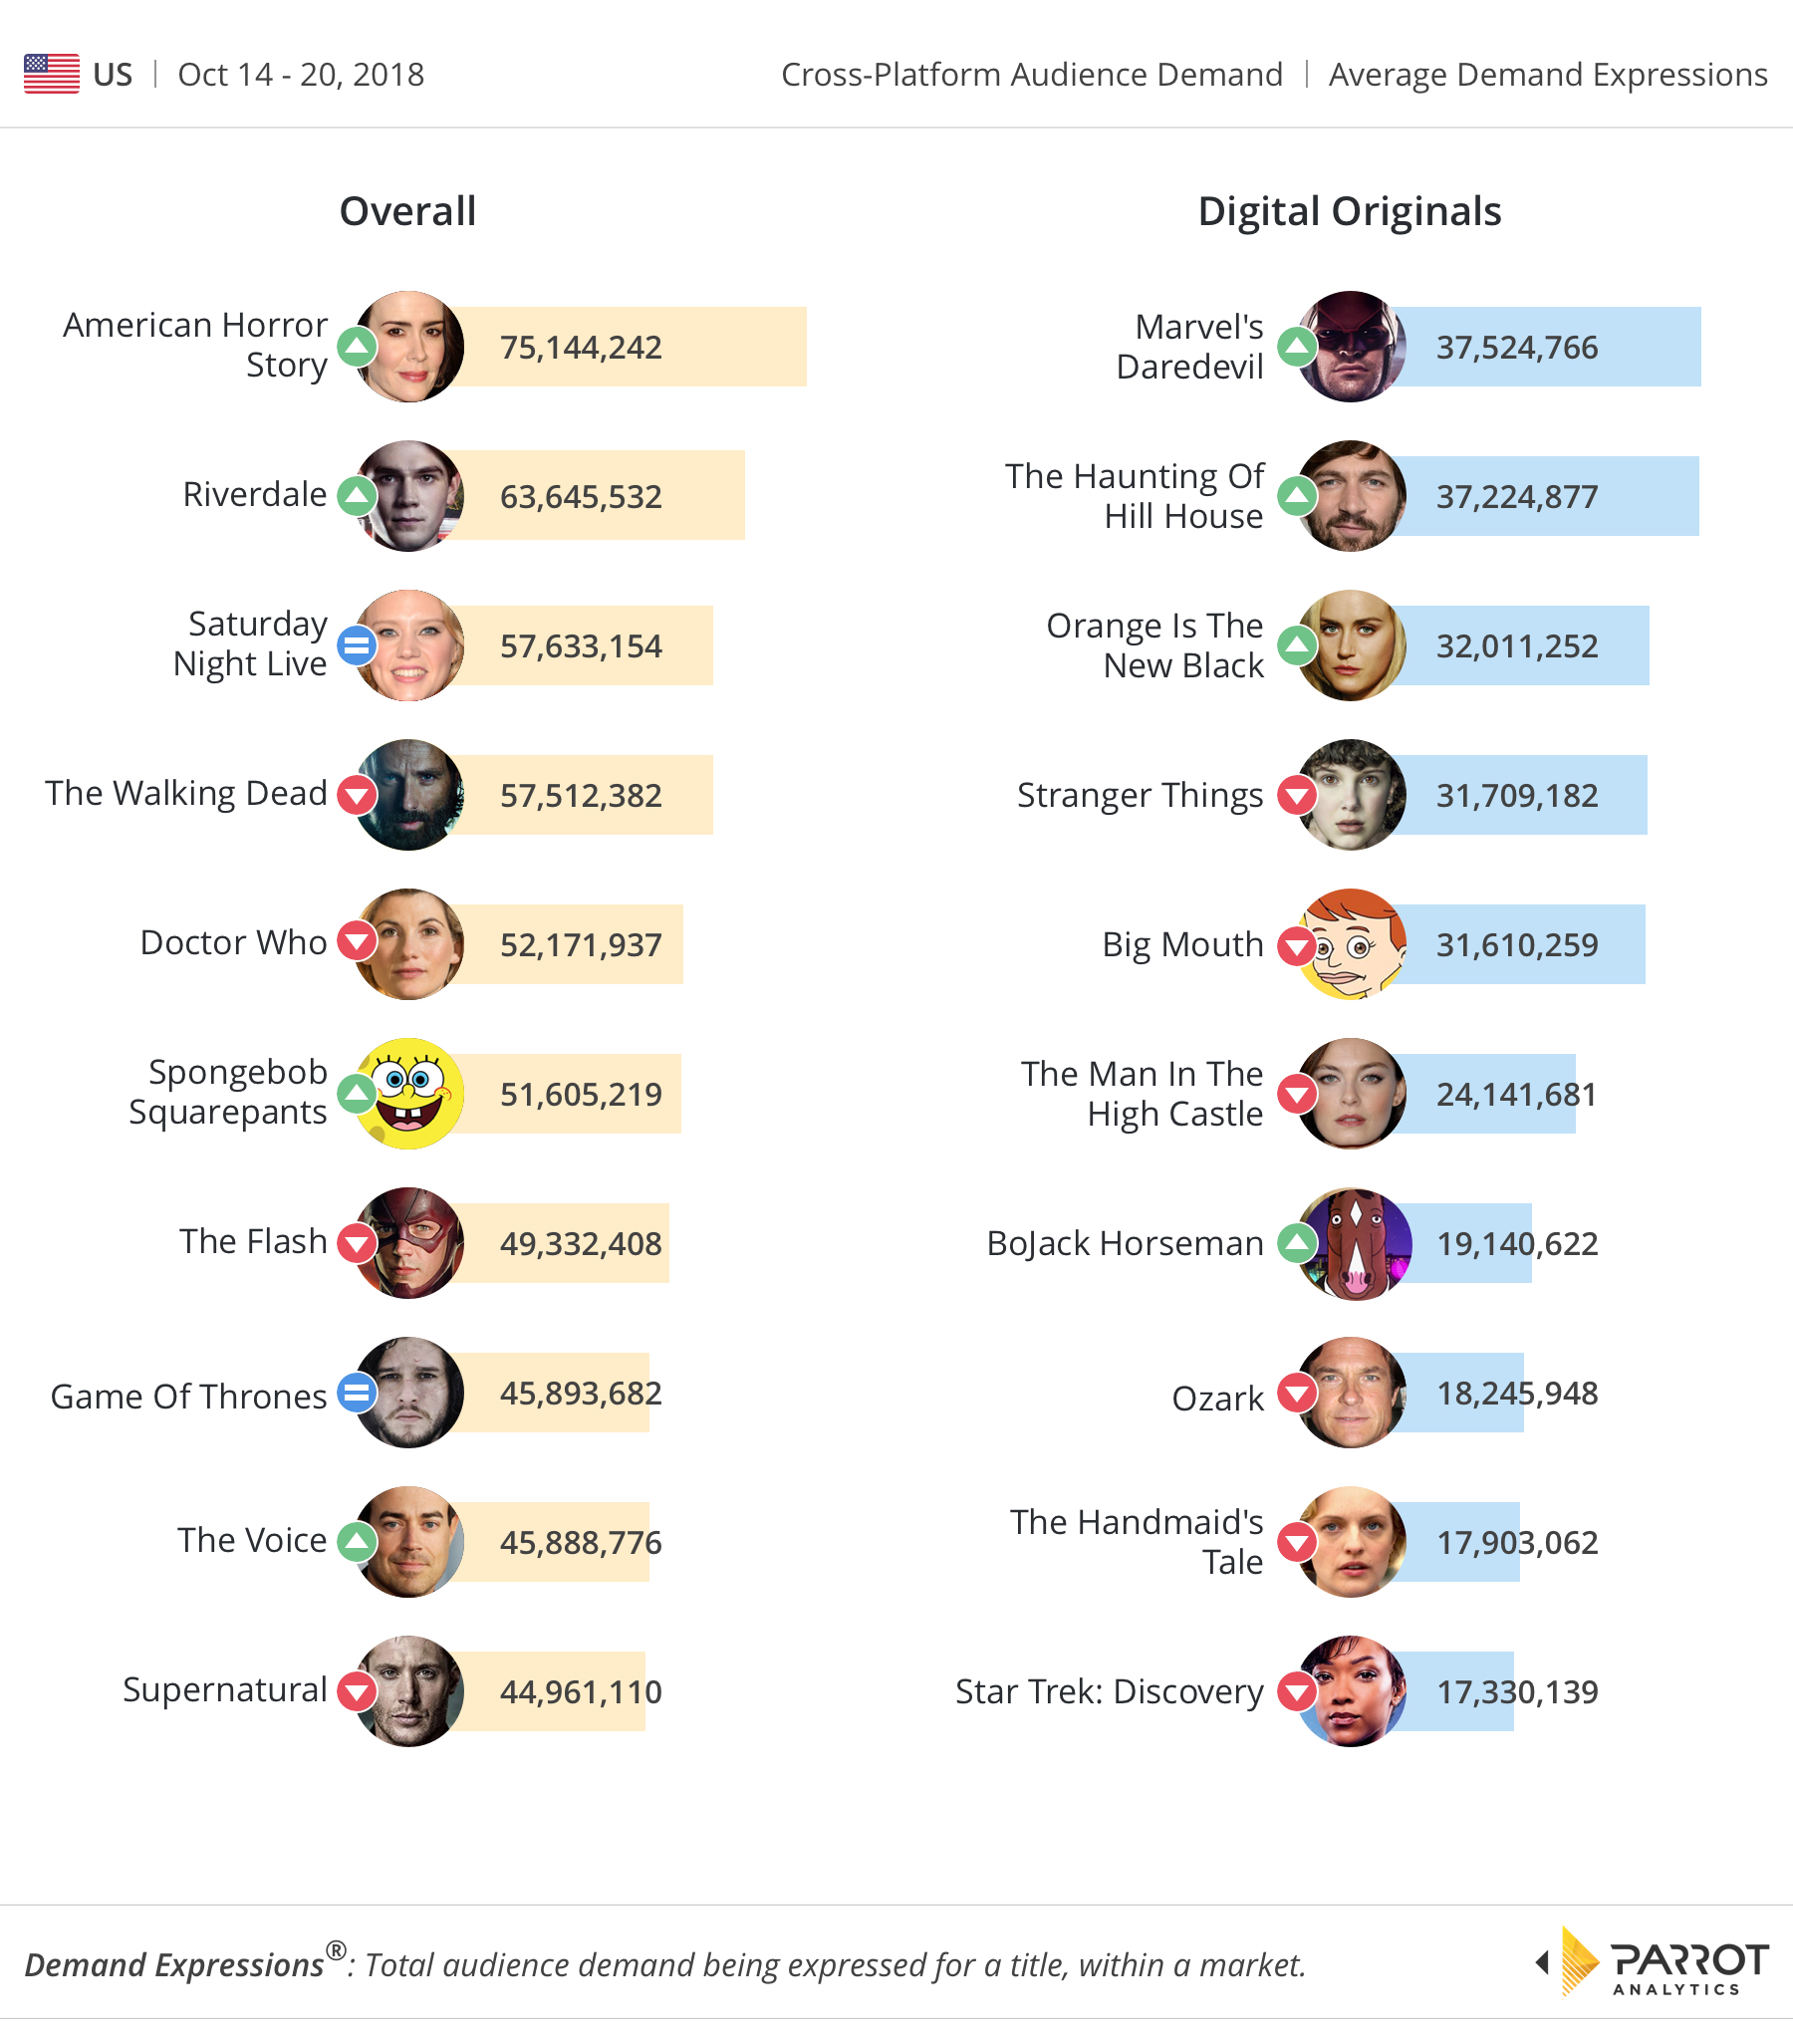
TV demand data, powered by Demand Expressions, is a universal measurement standard that enables the industry to quantify which television series across all networks and platforms are most wanted. Our global, real-time system is able to generate a country-specific audience demand footprint for content in 100+ countries. And as we do each week, let us now take a look at the America’s domestic demand numbers for streaming digital originals, as well as all TV series, across all platforms in the U.S.
Firstly, Marvel’s Daredevil is the #1 most wanted series in the week ending October 20th with 37.5 million average daily Demand Expressions, likely on the back of Netflix releasing the third season on October 19th. The superhero series debuted to solid reviews, and in our TV demand chart for digital series, the drama gained 41% in demand compared to last week.
The second most wanted series, The Haunting of Hill House, which the American streaming company commissioned with 10-episodes, is based on the 1959 novel of the same name by Shirley Jackson, jumped from No. 25 last week to No. 2. The supernatural drama series is likely spurred on by the upcoming Halloween festival, and we therefore expect it to stay in the TV demand chart for the rest of October. The Haunting of Hill House had around 16% more demand compared to Orange is the New Black, which grew in demand on the back of the news that season seven will be the last season, hitting the streaming service next year.
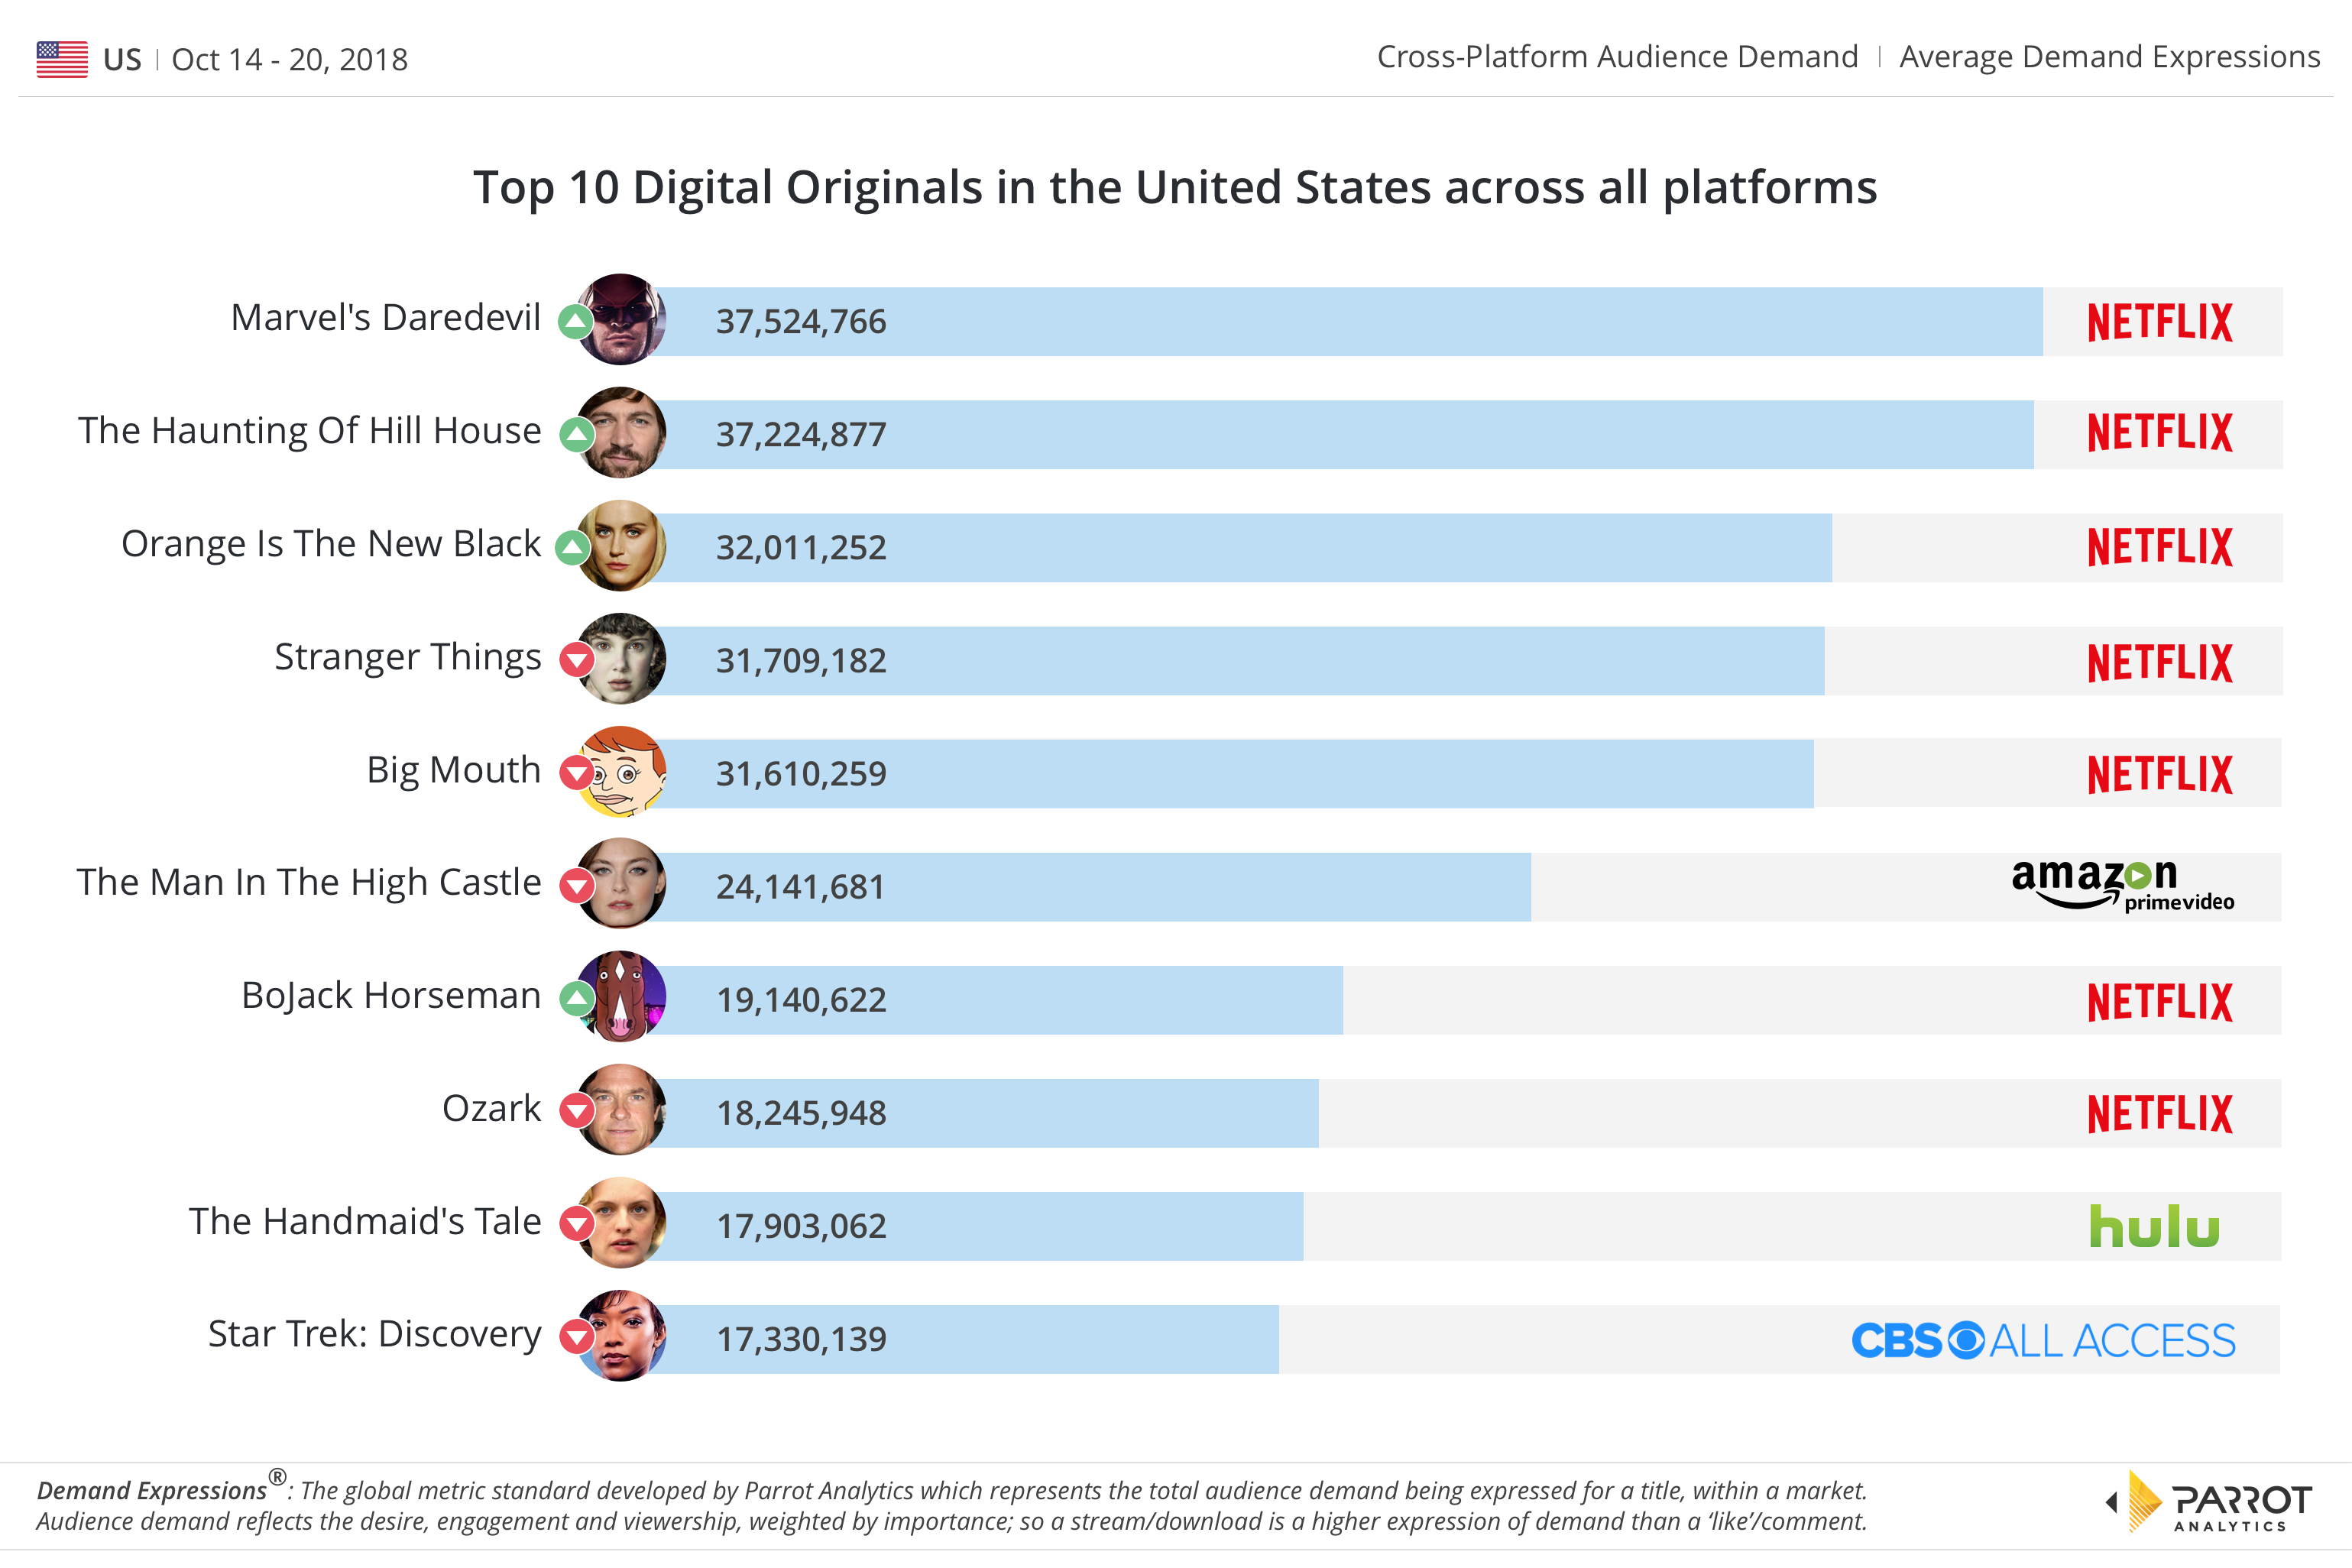
The other Netflix series that were both hits in 2017 – Ozark and Big Mouth – saw demand fall roughly 20% after peaking the week prior. Meanwhile, Amazon Prime Video’s The Man in the High Castle is still the sixth most wanted digital original series with 24.1 million average daily Demand Expressions, down two places compared to last week.
On the overall chart, hour-long genre distinction dramas with serialized elements dominated the top five rankings together with NBC’s Saturday Night Live. The most significant TV demand changes can be seen with CW’s Riverdale, which launched its third season on October 10th, gaining roughly 25% compared to the prior week which pushed the series into the sixth-most wanted position on the overall chart.
For more information, reach out to Parrot Analytics for a live demonstration of our Demand Portal, or watch our latest product video.
The data in this article are based on Demand Expressions (DEX). DEX is the globally standardized TV measurement metric developed by Parrot Analytics, which represents the total audience demand being expressed for a title, within a market. Audience demand reflects the desire, engagement and viewership, weighted by importance; so a stream/download is a higher expression of demand than a ‘like’/comment.

